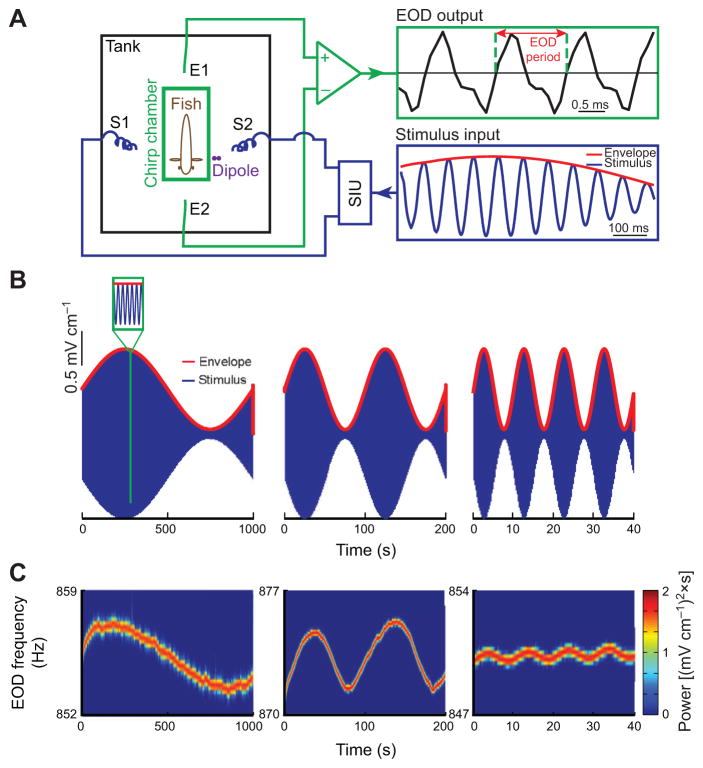
Fig. 1. Behavioral responses of weakly electric fish to second-order stimuli.
(A) Schematic of the experimental setup in which a fish is restrained in a tube (‘chirp chamber’) placed in an otherwise empty tank. The animal’s electric field is monitored by a pair of electrodes located in front and behind the animal (straight lines; E1, E2) while the stimulus is delivered using a separate set of electrodes positioned on each side (spirals; S1, S2). SIU, stimulus isolation unit. (B) Example stimuli showing the carrier (blue) and the envelope (red) for three different envelope frequencies using a carrier of 15 Hz. Left: 0.001 Hz; middle: 0.01 Hz; right: 0.1 Hz. The inset shows a magnification of the stimulus. (C) EOD spectrograms (i.e. EOD power spectrum as a function of time) showing behavioral responses to the stimuli shown in B from an example specimen of Apteronotus leptorhynchus.

