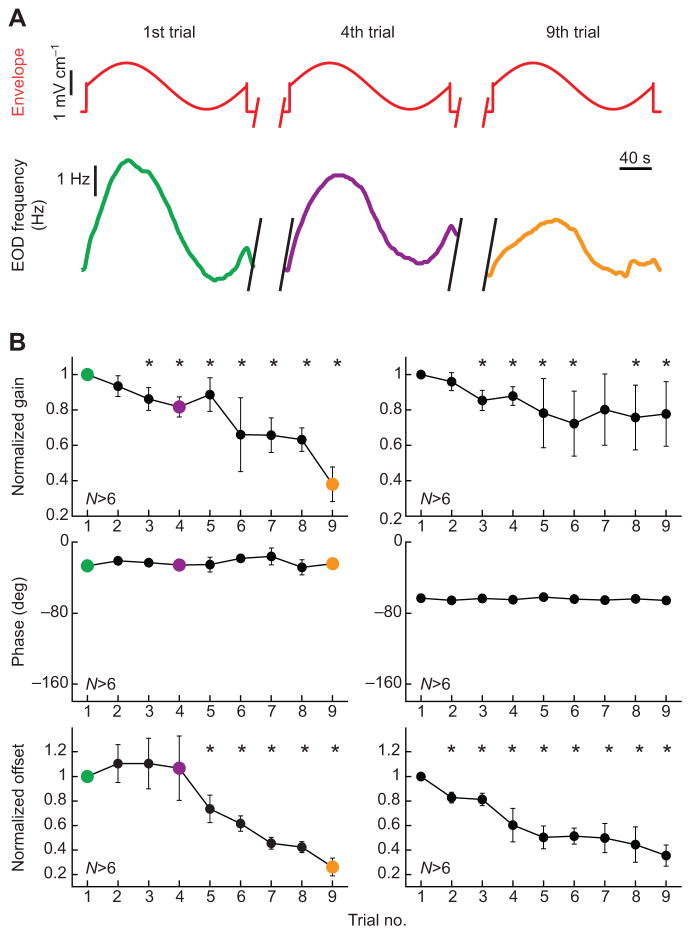
Fig. 5. Behavioral responses habituate and strongly depend on envelope frequency content.
(A) Envelope stimulus (top) and EOD frequency response (bottom) during the first (left), fourth (center) and ninth (right) trial in A. leptorhynchus.
(B) Normalized gain (top), phase (center) and normalized offset (bottom) as a function of trial number for envelope frequencies of 0.005 Hz (left) and 0.2 Hz (right). Asterisks indicate statistically significant difference to the first trial at the P=0.05 level, using a paired t-test.

