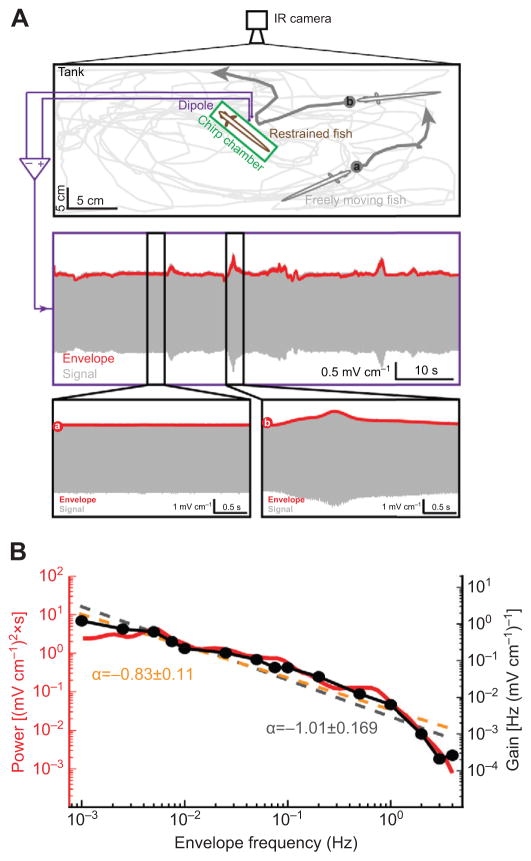
Fig. 8. Behavioral responses are adapted to natural statistics of movement envelopes.
(A) Top: behavioral setup in which a freely moving fish interacts with a restrained fish. The freely moving fish’s trajectory during an example session is shown in light gray and was filmed using an IR camera. The dark gray arrows depict two different movement patterns of the freely moving fish: one where the fish was swimming far away from the restrained fish (a) and a second situation where the fish showed a looming motion towards the restrained fish (b). Center: signal (gray) and envelope (red) recorded by the dipole. Bottom: signal (gray) and envelope (red) corresponding to the trajectories a and b are shown in the left and right panels, respectively. (B) Power spectrum of the envelope signal and best power law fit (orange dashed line) with power law exponent α=−0.83±0.11 (R2=0.86). Superimposed is the gain measured for A. leptorhynchus from Fig. 2B whose best power law fit (gray dashed line) had an exponent α =−1.01±0.169 (R2=0.93). Note that the ranges are the same for both y-axes. Therefore, because exponents did not differ significantly from one another (P>0.05, paired t-test) both curves can be described by the same power law up to a proportionality constant.

