Figure 1.

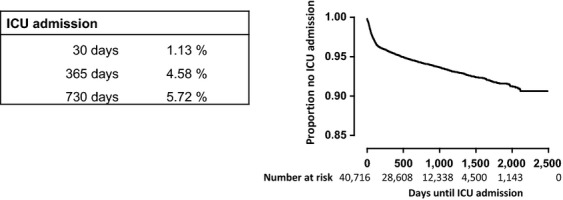
Kaplan–Meier curve for time until intensive care unit admission for all cancer diagnoses. The graph shows the time to ICU admission from opening of the diagnosis treatment combination for all 40,716 cancer diagnoses.

Kaplan–Meier curve for time until intensive care unit admission for all cancer diagnoses. The graph shows the time to ICU admission from opening of the diagnosis treatment combination for all 40,716 cancer diagnoses.