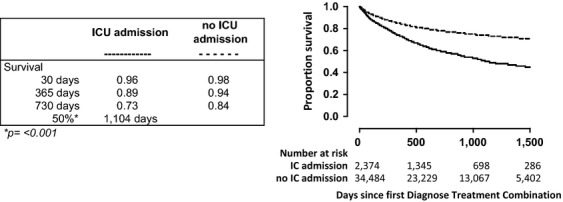
Figure 2.

Survival of cancer patients who were or were not admitted to the ICU. Survival of cancer patients who were (solid line) or who were not (dotted line) admitted to the ICU. This analysis encompassed 36,860 adult patients registered with a cancer diagnosis between January 1, 2006 and January 1, 2011 in four hospitals in the Netherlands. Of these patients, 2374 were admitted to the ICU during the study period. The graph shows Kaplan–Meier curves starting at the date of cancer diagnosis registration; p value indicates the difference between groups.
