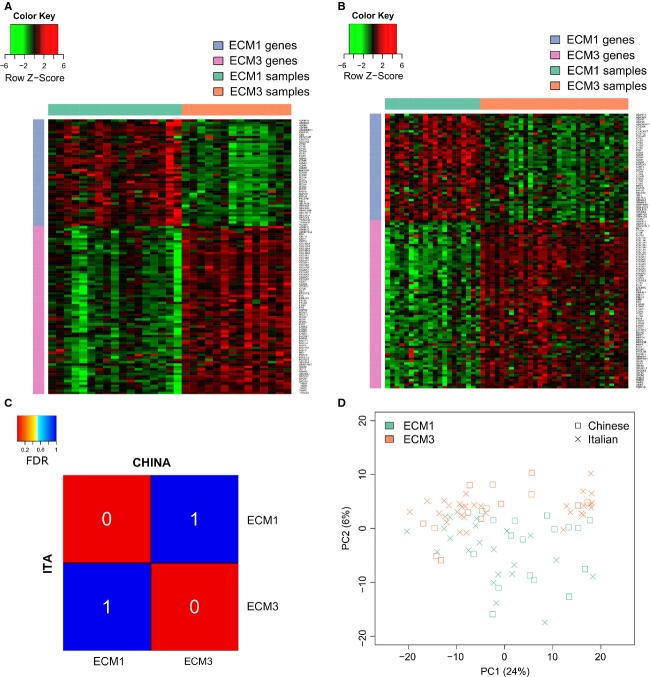
Figure 3.
ECM3 and ECM1 subtyping in Chinese and Caucasian breast tumors. Heat map shows the expression profile of ECM3 and ECM1 genes in Chinese (A) and Caucasian (B) tumors identified by LAS biclustering. (C) Heat map of the subclass association matrix obtained by SubClass Mapping revealed nearly identical gene expression of ECM subtypes identified in the Chinese and the Caucasian datasets. FDR (white) represents the significance of the similarity. ITA and CHINA indicate Caucasian Italian and Chinese samples, respectively. (D) PCA analysis of microRNA (miRNA) expression data in Chinese and Caucasian ECM3 and ECM1 breast tumors indicates the greater role of ECM classification than of race/ethnicity in grouping of Chinese and Caucasian samples. ECM, extracellular matrix; PCA, principal component analysis; FDR, false discovery rate; LAS, Large Average Submatricies.

