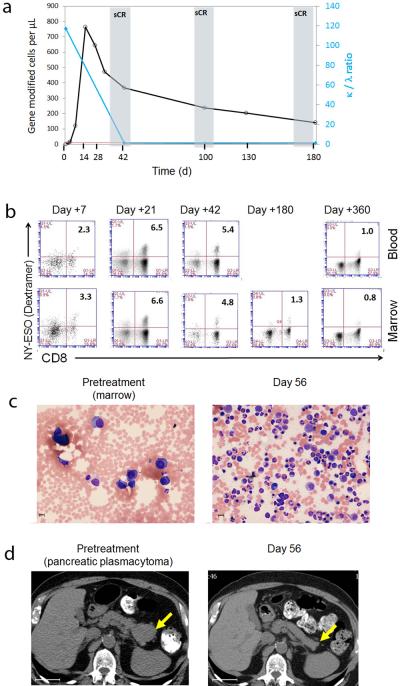
Figure 4. Clinical response in patient 250 correlates with engineered T cell expansion.
(a). The number of NY-ESO specific T-cells per microliter of blood is shown for patient 250, and is overlaid with the corresponding tumor burden assessed at days 42 - 180 post infusion. The kappa/lambda light chain ratio is shown on the right axis; n.b. that when ratio becomes normalized, plot is superimposed on X-axis. (b). The levels of TCR expression on CD8 T-cells over time were measured by peptide/HLA-A2 dextramer in marrow and blood; samples were gated on CD3+ lymphocytes. The percent double positive cells is represented by the number in the upper right hand corner. (c). H&E stain of a marrow biopsy pre and post treatment, demonstrating normalization of cellularity at two months. Note the magnification is slightly higher in the left panel. (d). Abdominal CT scan showing a pancreatic plasmacytoma (confirmed by biopsy) at baseline, and loss of the tumor two months after treatment. Bars in panel (c) are 10 microns and bars in panel (d) are 4 centimeters.

