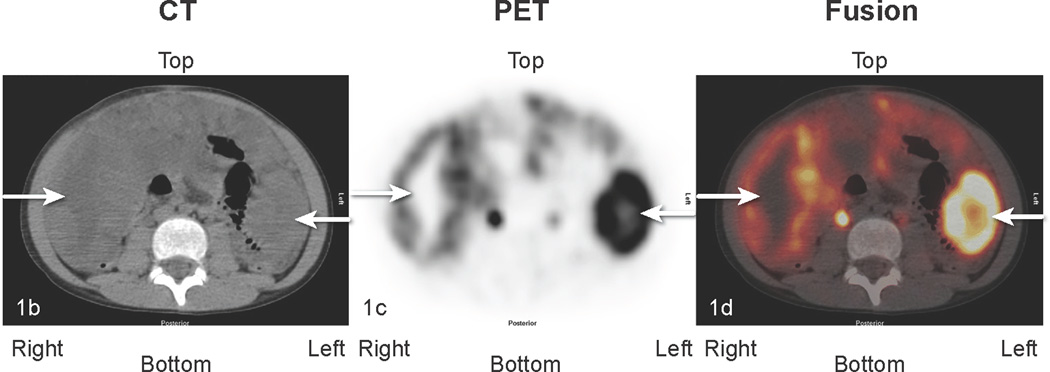
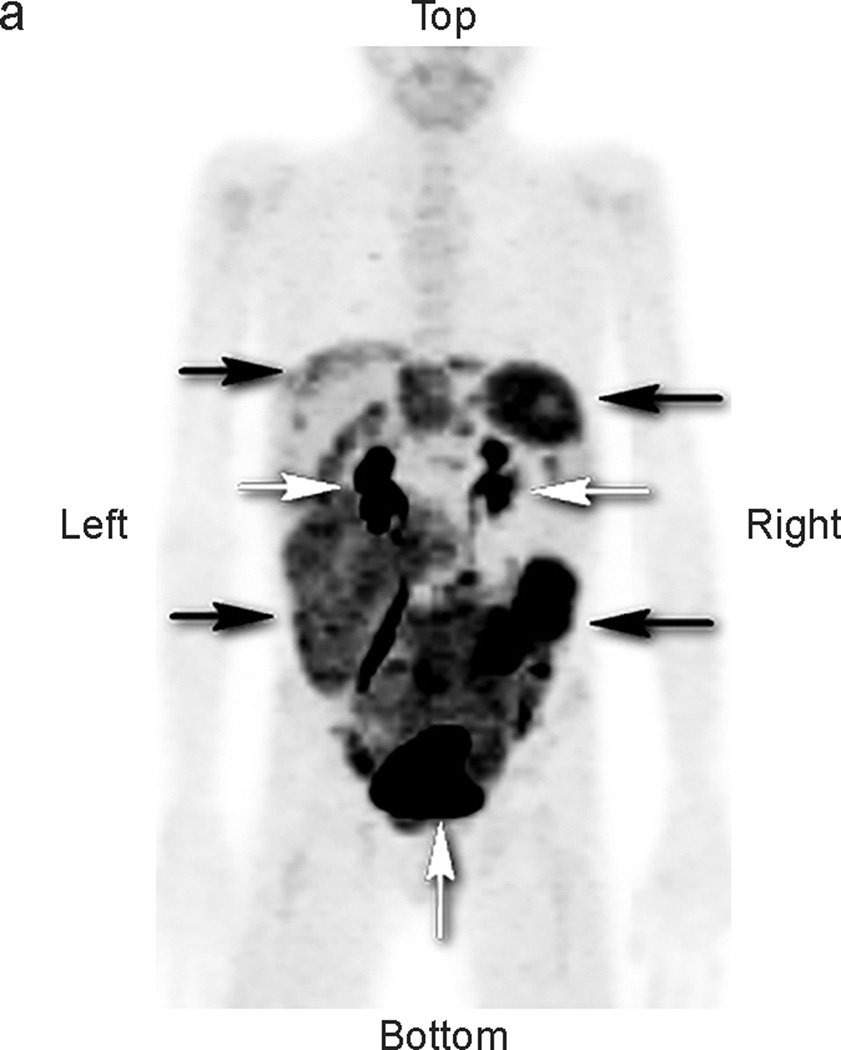
Fig 1.

Patient #2: 11-year-old boy with DSRCT showing widespread abdominal and pelvic FDG uptake that decreased in serial scans. a) Anterior maximal intensity projection image (MIP). There is widespread abnormal uptake throughout the abdomen and pelvis (black arrows). Renal excretion and bladder accumulation are noted (white horizontal arrows – kidneys; white vertical arrow at bottom of image – bladder. b,c,d: transverse CT, PET, and fusion images of the mid abdomen. There is extensive tumor present. The white arrows pointing to the right indicate an area of low attenuation on the CT image, corresponding to areas without uptake of FDG on the PET image. The white arrows pointing to the left in each image identify an area of intense tumor uptake.

