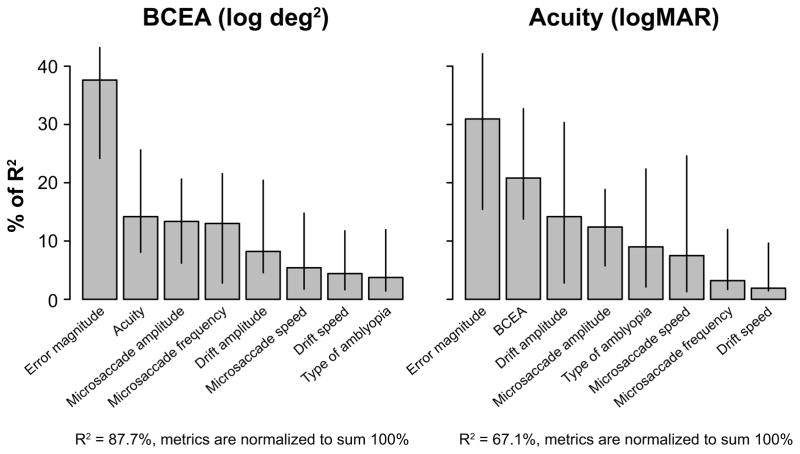
Figure 4.
Percentage of R2 of BCEA (log transformed values) and acuity (logMAR) accounted for by each of the parameter listed on the x-axes, as determined using the R package relaimpo. The relative importances of these parameters are ranked according to the lmg metric. Error bars represent ±95% confidence intervals estimated using bootstrappings, based on 10,000 resamplings.

