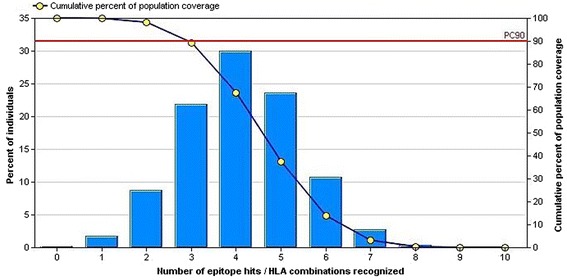
Fig. 3.

Population coverage based on MHC–I and MHC-II restriction data. The whole world populations are assessed for the proposed epitope. Notes: In the graphs, the line (−o-) represents the cumulative percentage of population coverage of the epitopes; the bars represent the population coverage for each epitope
