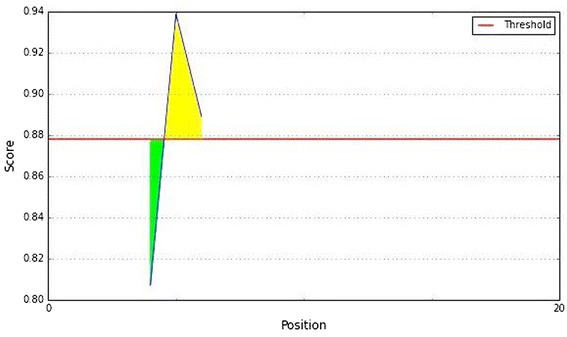
Fig. 7.

Chou and Fasman beta turn prediction of the epitope,with a minimum propensity score of 0.878 and maximum score of 0.939. Notes: The X- and Y-axes represent the sequence position and antigenic propensity score, respectively. The threshold value is 1.0. The regions above the threshold are antigenic, shown in yellow
