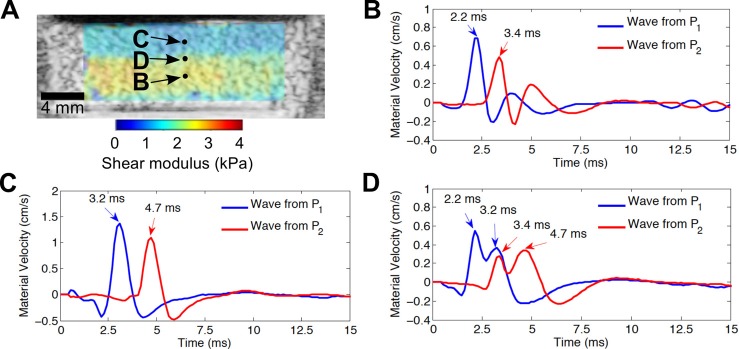
Fig. 3.

(Color online) Profiles of waves propagating within phantom. (A) B-scan and overlaid shear modulus images of a uniform gelatin phantom in a tissue culture plate. Wave profiles are presented as the axial component of the material velocity as a function of the time it took for the wave to propagate laterally from the region of excitation to the tracking location. Wave profiles corresponding to (B) a location within the deeper region with higher shear modulus estimates, (C) a location within the shallow region with lower shear modulus estimates, and (D) the transition point between the shallow region and the deeper region. Blue and red curves correspond to profiles of the propagating waves generated by the first acoustic radiation force excitation at location P1 and the second acoustic radiation force excitation at location P2, respectively. Results are representative of three separate samples.
