
FIG. 2.
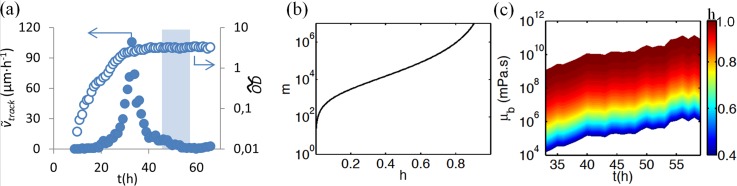
(a) Time-dependent track and (solid and hollow circles, respectively) based on 40 tracks. The blue box shows the time interval for observed streamers formation. (b) The contour of track = 0.000422 versus m and h. (c) Biofilm viscosity changes during transformation to maturity for 0.4 ≤ h ≤ 0.98, where the colour represents the normalized biofilm height.