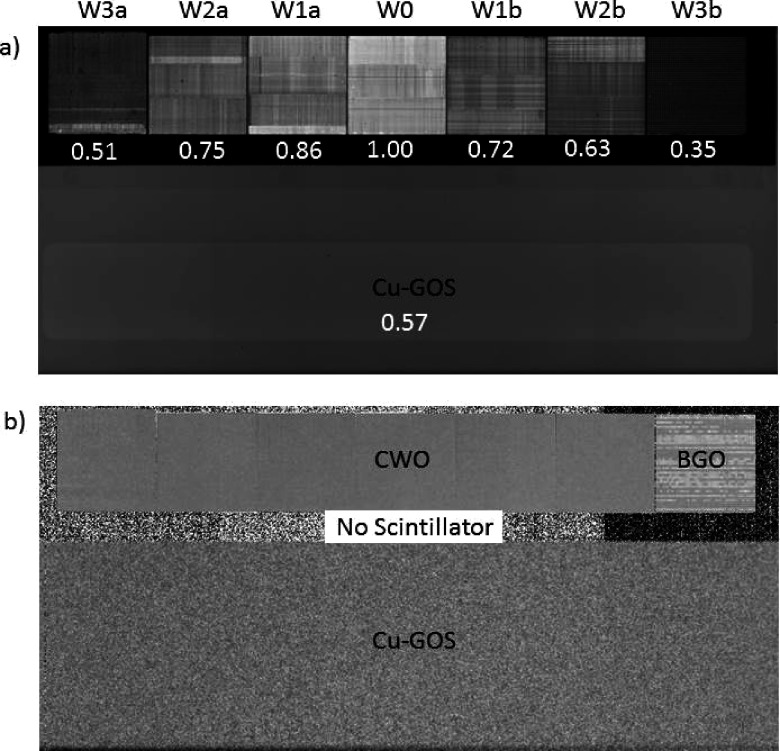
FIG. 12.
(a) Raw data flood-field image (FF1) showing the scintillator strip (not gain corrected) and the GOS region. The relative signal intensities of each of the subarrays are shown below each subarray. (b) Normalized noise image NDiff computed using Eq. (6). The window width is 1.5%. Increased stochastic noise is seen in the Cu-GOS region, and increased patterned noise is seen in the BGO subarray. The measured CWO sensitivity is 22.5 × Cu-GOS sensitivity based on SNR measurements (see Table II).

