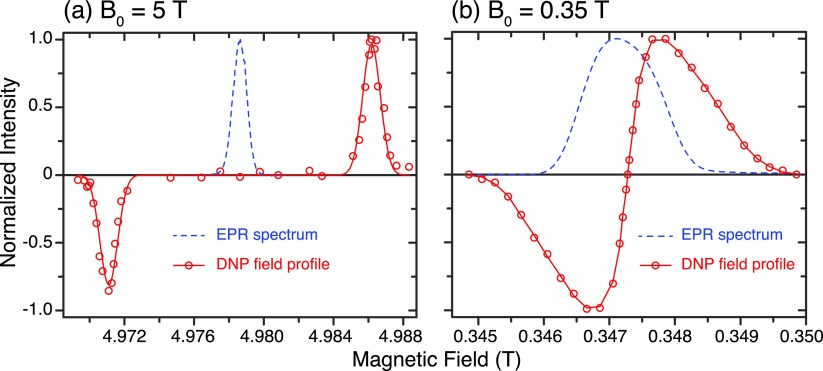
FIG. 3.
EPR spectrum (dashed blue) and DNP field profile (red) of single crystal DPNO/BzP at 5 T (a) and 0.35 T (b). The magnetic field B0 is along the crystallographic b-axis of the crystal; thus, the EPR spectra contain only one peak with four-fold degeneracy. The DNP field profile at 5 T shows a well-resolved solid effect as opposed to an unresolved solid effect at 0.35 T. The maximum enhancement is 330 at 0.35 T and remains unknown at 5 T. Experiments at 5 T were performed at 80 K, whereas experiments at 0.35 T were performed at 270 K.

