Fig. 5.
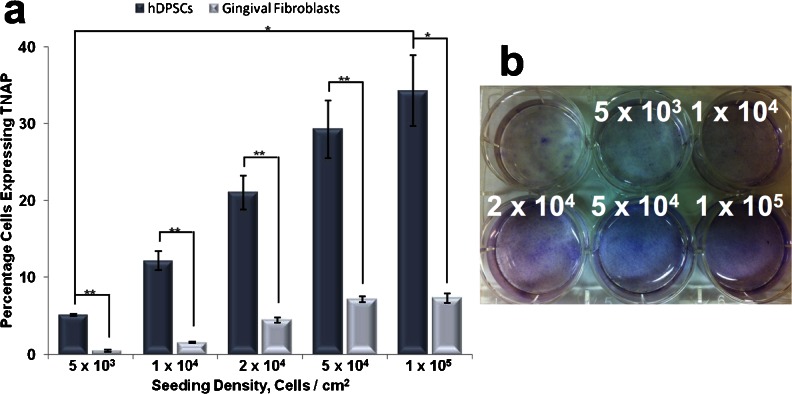
Production of TNAP with increasing cell density. a Flow cytometric analysis of TNAP expression by hDPSCs and hGFs with increasing cell density showing the percentage of cells to express TNAP. b Cytological staining of TNAP in cell cultures seeded with increasing density using napthol AS-MX and Fast blue RR salt. These data show that TNAP expression increases with increasing cell density. n = 5. *p ≤ 0.05, **p ≤ 0.01

