Fig. 7.
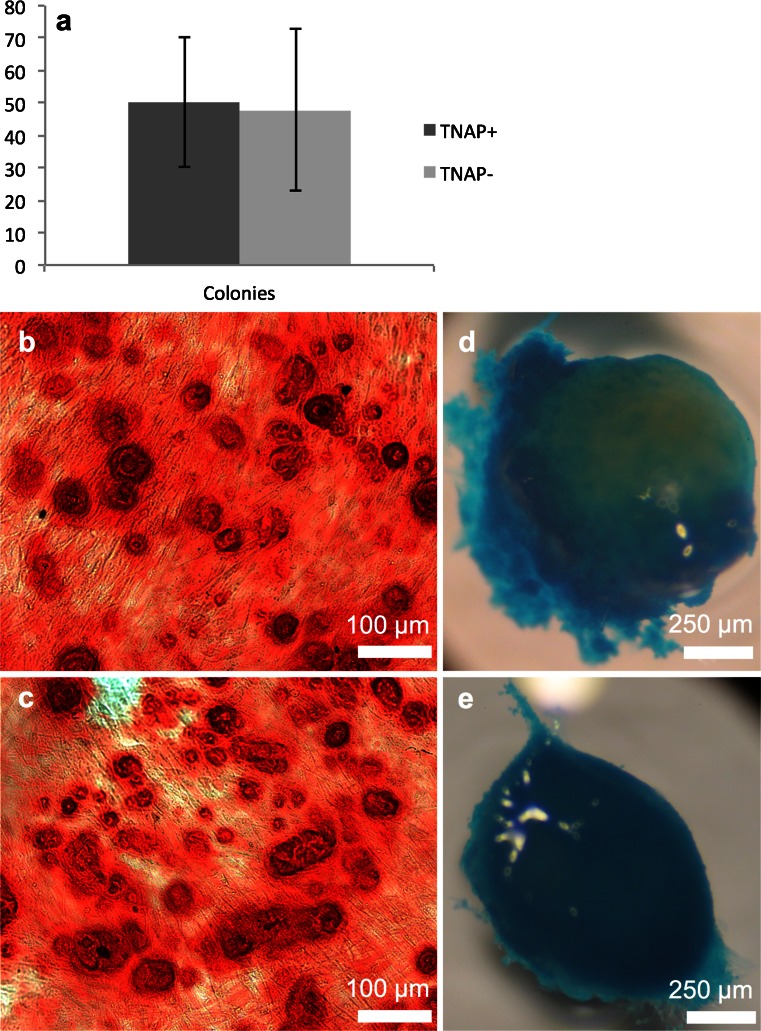
Sorting of hDPSCs for TNAP. a Graph showing CFU-f formation by TNAP+ and TNAP- hDPSCs, no significant difference was observed, n = 20. b Alizarin red staining of osteogenically differentiated TNAP+ hDPSCs; c TNAP− cells showing capacity of hDPSCs to mineralize. d Alcian blue staining of a chondrogenically differentiated TNAP+ hDPSC pellet; e a TNAP– pellet showing GAG production by pelleted hDPSCs. Scale bar 100 μm for alizarin red-stained samples, 250 μm for alcian blue-stained pellets

