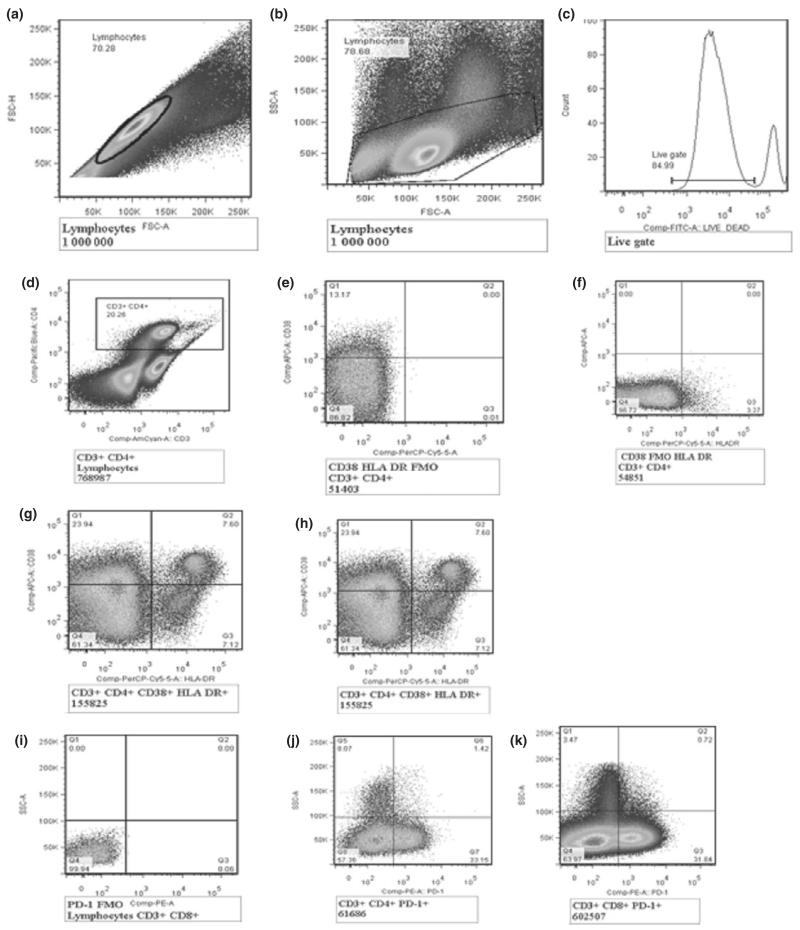
Figure 2.
Gating strategy for T-cell activation and exhaustion. (a) shows singlets/duplets, (b) shows FSC with lymphocyte gate, (c) shows the live gate, (d) shows CD3 + CD4 + T cells, (e) shows CD38-APC vs. fluorescence minus one (FMO) HLADR-PerCP cy5.5, (f) shows FMO CD38-APC vs. HLADR- PerCP cy5.5, (g) shows CD4 T-cell activation (CD3 + CD4 + CD38 + HLADR+) and (h) shows CD8 T-cell activation (CD3 + CD8 + CD38 + HLADR+), (i) shows programmed death (PD-1) FMO, (j) shows CD4 T-cell exhaustion (CD3 + CD4 + PD1 + ) and (k) shows CD8 T-cell exhaustion (CD3 + CD8 PD1 + ).

