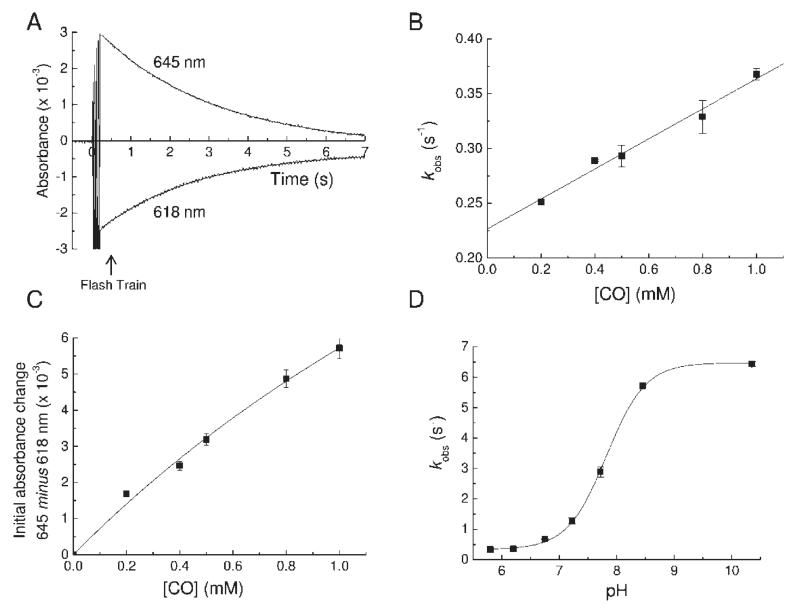
Figure 3.
Photolysis and recombination of ferrous MPO–CO. For all experiments the MPO concentration was 1.6 μM. (A) Typical transient absorption changes at 618 and 645 nm following flash photolysis of the ferrous MPO–CO complex at pH 6.3. The transient decay kinetics follows a single exponential with a pseudo-first-order rate constant (kobs). (B) Plot of kobs as a function of CO concentration at pH 6.3. The slope of a linear fit to the data gave the true second-order rate constant for CO binding (kon), and its y-axis intercept gave the dissociation rate constant (koff). (C) Plot of the initial absorbance change at 645 nm minus 618 nm after a train of flashes as a function of CO concentration at pH 6.3. (D) pH dependency of kobs. The points are overlaid with a Henderson–Hasselbalch curve for an acid/base group with a pK of 7.8.

