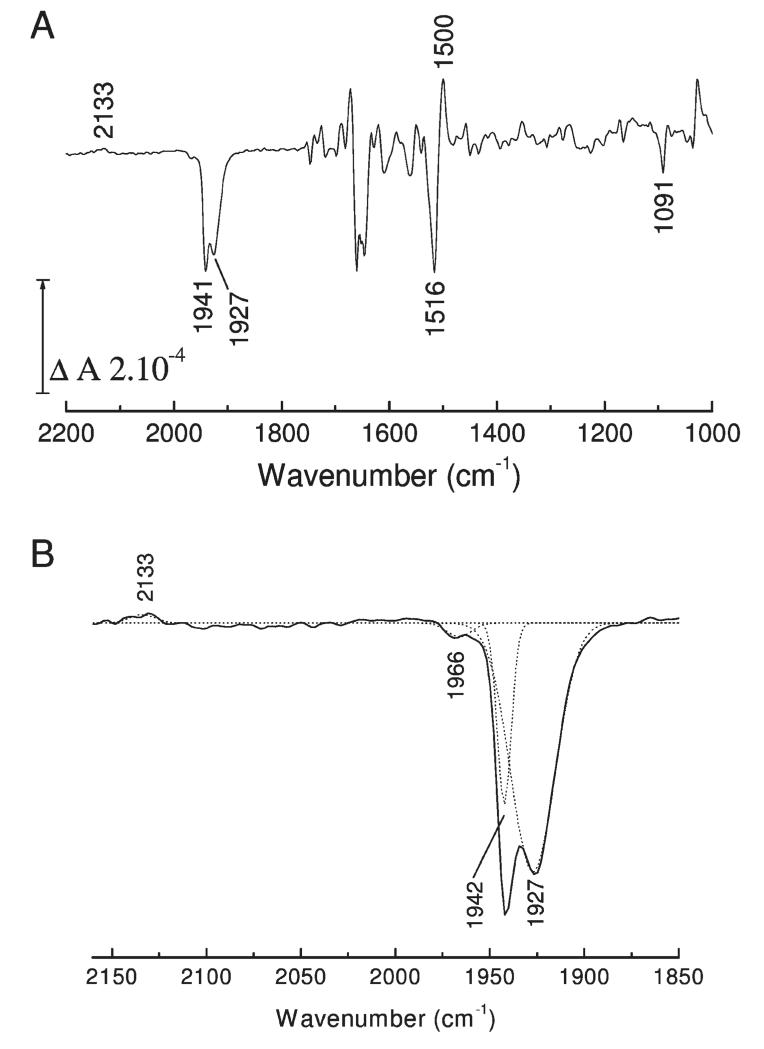
Figure 4.
FTIR difference spectrum of CO photolysis. (A) Ferrous minus ferrous–CO spectra of MPO were recorded at pH 7.3 as described in Experimental Procedures. CO and protein modes discussed in the text are labeled. (B) Enlargement of the 2160–1850 cm−1 spectral region. CO bands were simulated with four Gaussian functions centered at 2133, 1966 (2%), 1942 (18%), and 1927 (80%) cm−1 with fwhm of 14 ± 4, 13 ± 2, 7, and 22 cm−1, respectively.

