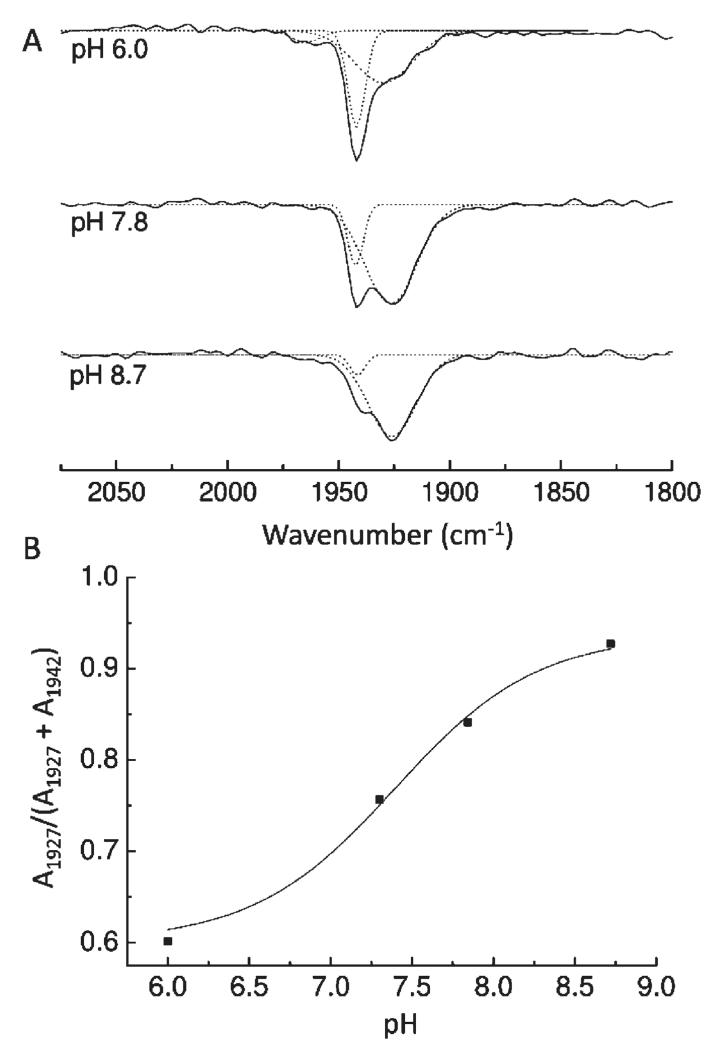
Figure 5.
pH dependency of the IR bands of ferrous MPO–CO. (A) CO photolysis difference spectra were recorded at pH 6.0, 7.8, and 8.7 as for Figure 4. CO bands were simulated with two or three Gaussian functions as necessary. (B) pH effect on the proportion of the 1927 cm−1 form, expressed as a fraction of the total integrated areas of the two main 1927 and 1942 cm−1 bands. Data are fitted with a Henderson–Hasselbalch equation for a single acid–base transition and gave a pKa of 7.4 ± 0.2.

