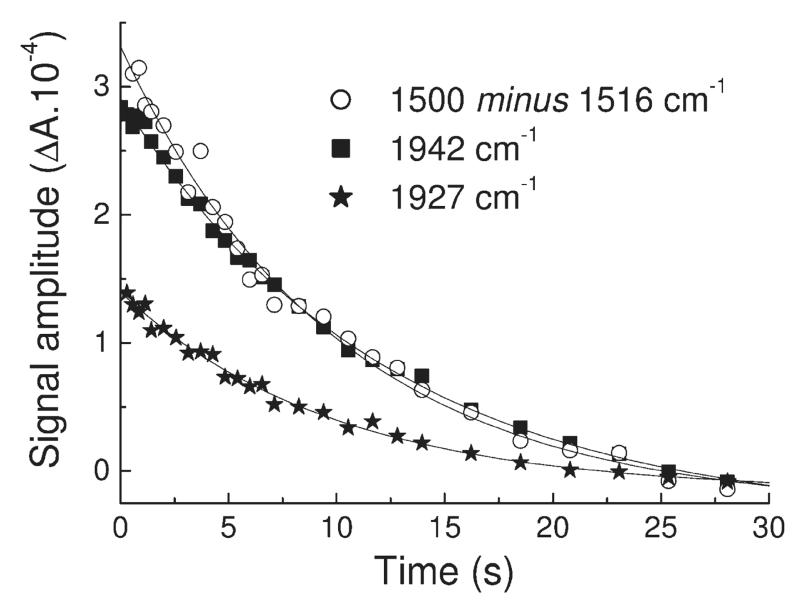
Figure 6.
Time-resolved rapid-scan FTIR transients during CO recombination with ferrous MPO at pH 7.8 and 277 K. Plots of absorbance versus time were extracted from the 3D data set of spectra after CO photolysis at 1942 cm−1 (squares) and 1927 cm−1 (stars) for the two main CO bands and at 1500 cm−1 minus 1516 cm−1 (open circles) for a typical example of band relaxation within the protein/heme region. Monoexponential fits of kobs ≈ 0.10 s−1 are overlaid.

