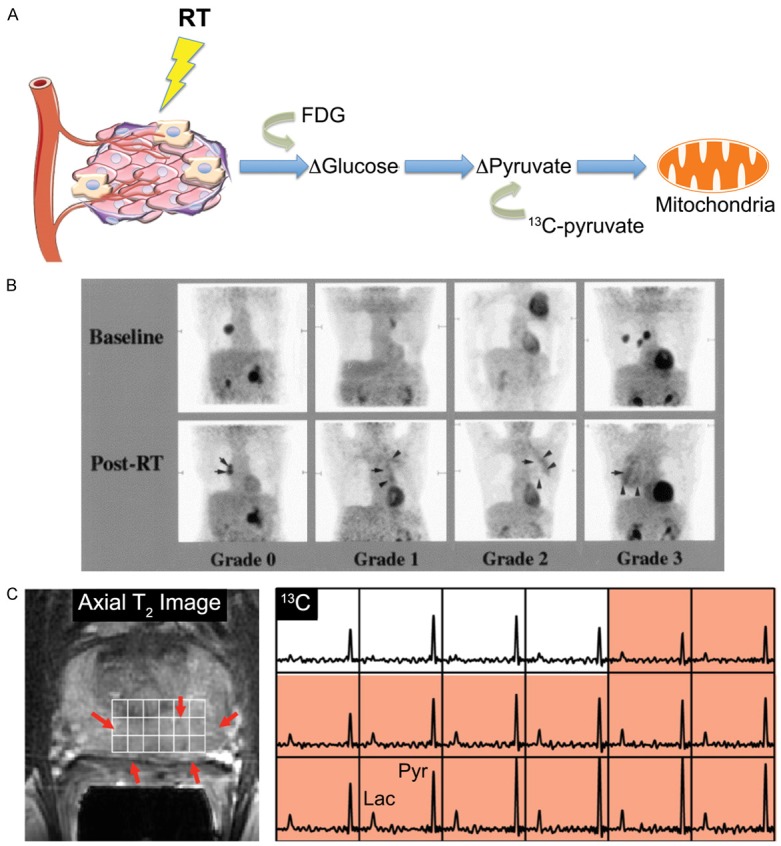
Figure 1.

Imaging metabolism. A. The complex tumor microenvironment, consisting of tumor cells, vasculature, stromal cells, and immune cells, plays a critical role in response to therapy. Techniques such as FDG-PET that use glucose analogs to observe cellular uptake or 1H or 13C MRI that monitor metabolites can evaluate metabolic changes in the tumor microenvironment following radiotherapy (RT). B. FDG-PET scans performed in 4 different patients with NSCLC before (Baseline) and 6-12 weeks after radiotherapy (Post-RT) are shown. Horizontal arrows highlight the original tumor site, oblique arrows designate a new tumor site, oblique arrowheads show pleural reaction, and vertical arrowheads indicate parenchymal lung changes. A qualitative scoring system was devised to evaluate normal tissue FDG uptake for the determination of radiation-induced changes in inflammation. Grade 0 shows no normal tissue abnormalities within the treatment volume. Grade 1 denotes activity in the pleural reflections and soft tissues without parenchymal lung changes. Grade 2 indicates increased parenchymal uptake of equal or lower intensity than normal soft tissues while Grade 3 shows uptake in the right lung parenchyma of higher intensity than surrounding normal soft tissues. Reprinted with permission from [18]. C. 13C-MRSI study in prostate cancer patient who received 0.43 mL/kg of hyperpolarized [1-13C]pyruvate. T2-weighted image through the malignant region (left) with corresponding 13C-MRSI spectral array (right). Pink shading represents tumor. Lac = lactate; Pyr = pyruvate. Adapted from [32].
