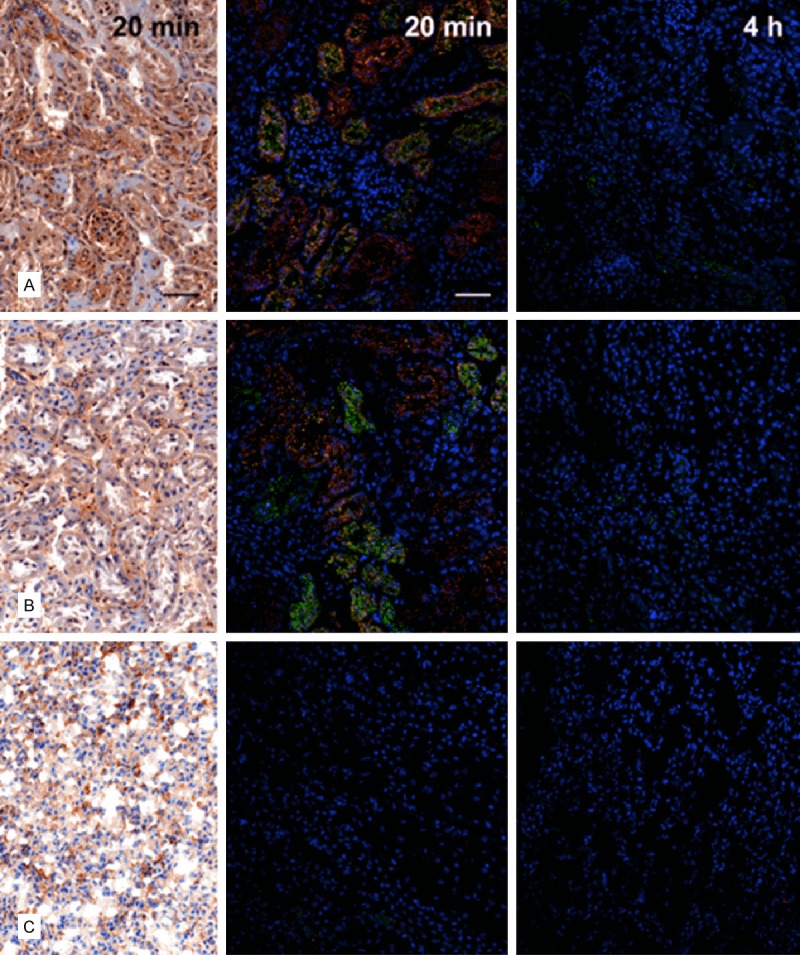
Figure 6.

Distribution of A1M immunoreactivity and octreotide-A647 in the kidney 20 minutes and 4 hours after i.v. injection. A1M immunoreactivity was detected with the K: 322 anti-A1M antibody, using IHC (left column; bright-field microscopy) or IF (middle and right columns; confocal microscopy) in cortex (A), medulla (B), and collecting ducts (C). Distribution of A1M IF (green) and octreotide-A647 (red), and their tubular co-localization (yellow), was investigated at 20 minutes (middle) and 4 hours (right) p.i. Cell nuclei were visualized using DAPI (blue). Scale bar represents 50 µm.
