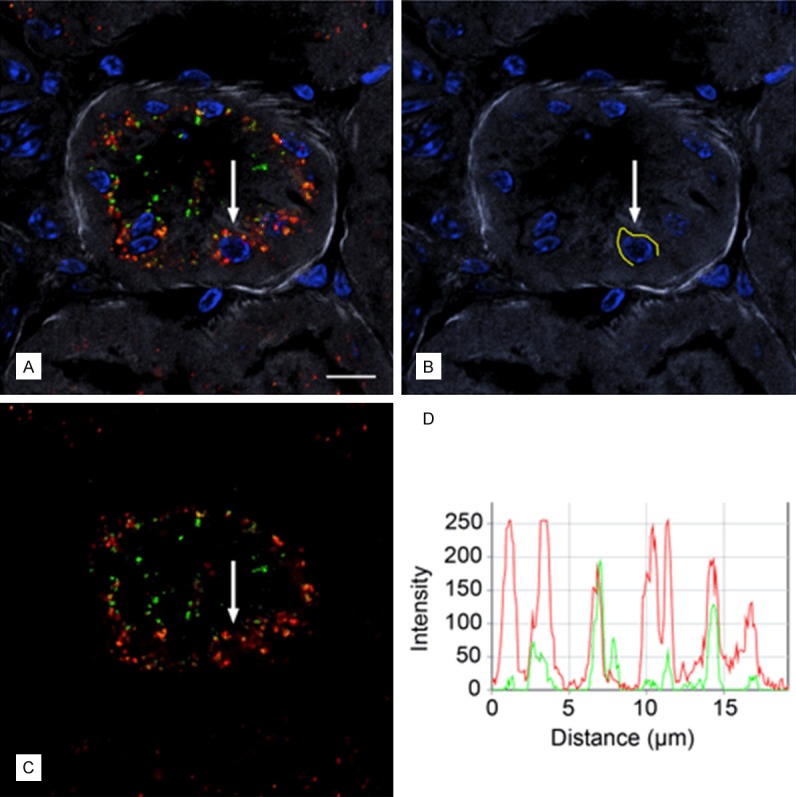
Figure 7.

Cellular co-localization of A1M IF and octreotide-A647 following i.v. injections. A1M and octreotide-A647 conjugate were injected i.v. and animals were terminated at 20 minutes following injection. High-resolution (63×/1.4 objective) confocal microscopic image shows the intracellular distribution of A1M IF (green) and octreotide-A647 fluorescence (red). Cell nuclei were stained with DAPI (blue), and phalloidin-Texas Red labeling (grey) was used to delineate tubular profiles. Resolution of punctuate fluorescence in one cell (A; arrow) was shown by measuring fluorescence intensities along a profile in the cytoplasm just outside the nucleus (B; yellow line), giving the intensities along the profile in the red and green channels (C) as an intensity profile (D) with 8 bits (256 intensity levels) per channel. Scale bar represents 10 µm.
