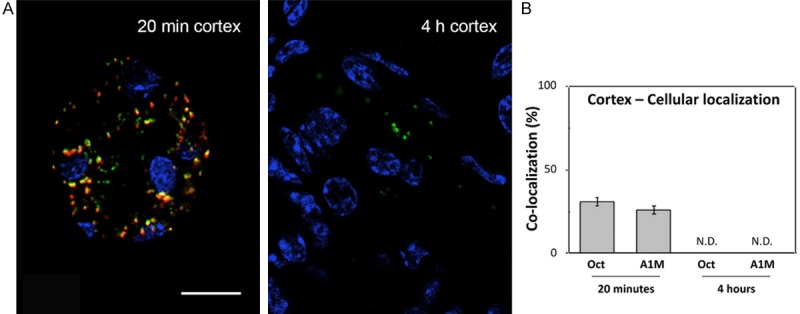
Figure 9.

Cellular co-localization of A1M and octreotide-A647 in cortex at high magnification. A1M and octreotide-A647 conjugate were injected i.v. and animals were terminated at 20 minutes and 4 hours p.i. The percentage of co-localized A1M (green) and octreotide-A647 (red) was calculated in selected tubular profiles in the cortex, in high-resolution confocal microscopic images (63×/1.4 objective). Cell nuclei were visualized using DAPI (blue). Representative profiles (A) show different degrees of intracellular co-localization (yellow), and the co-localization data from all investigated samples are presented as mean ± SEM of representative areas (B). Scale bar represents 20 µm.
