
Figure 1.
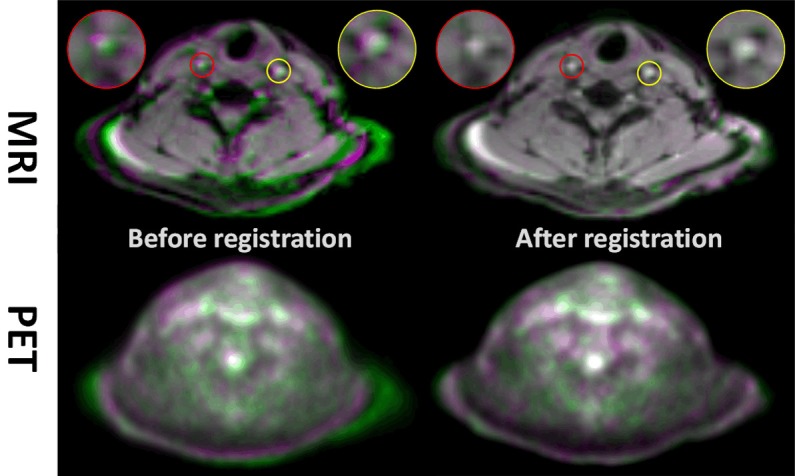
Data analysis was performed by registering the standard dose acquisition MR image to the low dose acquisition MR image. The measured transformation field is subsequently applied to the standard dose PET image before tracing of the ROIs. Top Panel: Low dose acquisition (green colormap) MR image overlapping the standard clinical dose acquisition MR image (purple colormap). Inserts are zoom-in of the left and right carotid to show accuracy of registration. When images are well registered, the overlap images turn to grayscale colormap (e.g. white signal indicates excellent overlap) Bottom Panel: Corresponding low and standard dose PET images.