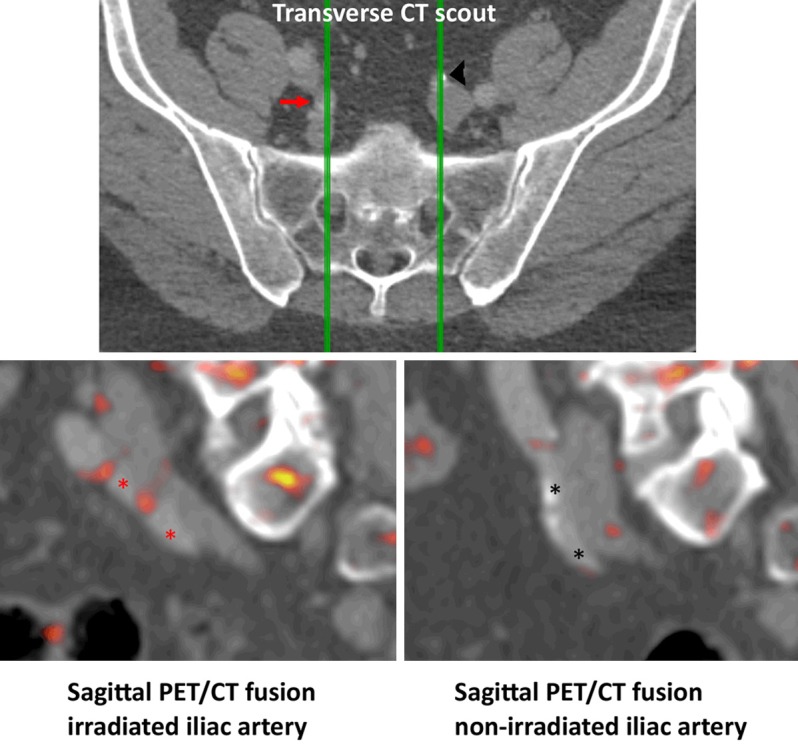
Figure 3.

Representative FDG-PET/CT from irradiated (red arrow and asterisks) and non-irradiated (black arrowhead and asterisks) internal iliac artery. The top-row show the contrast enhanced CT with green lines representing the sagittal planes used for the bottom-row FDG-PET fused with CT.
