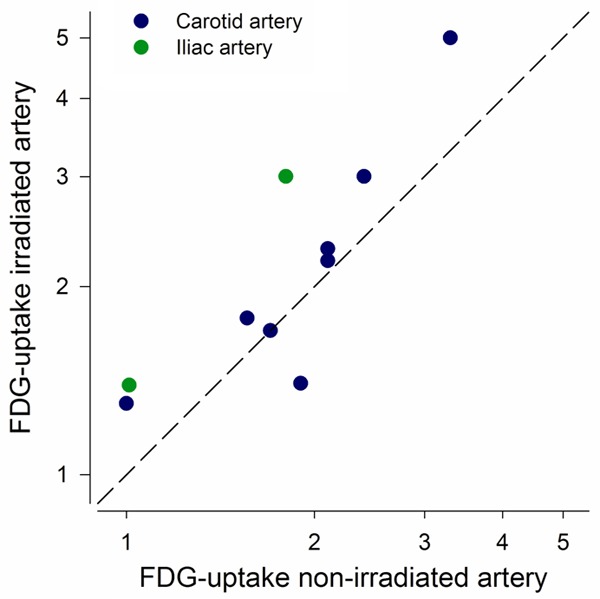
Figure 4.

Correlation between FDG-uptake (SUVmax) in the irradiated and contralateral non-irradiated artery from the 10 included patients. The dashed identity-line is shown in black. The carotid artery was compared in 8 patients (blue circle) and the internal iliac artery in another 2 patients (green circle). Axes are in logarithmic scale.
