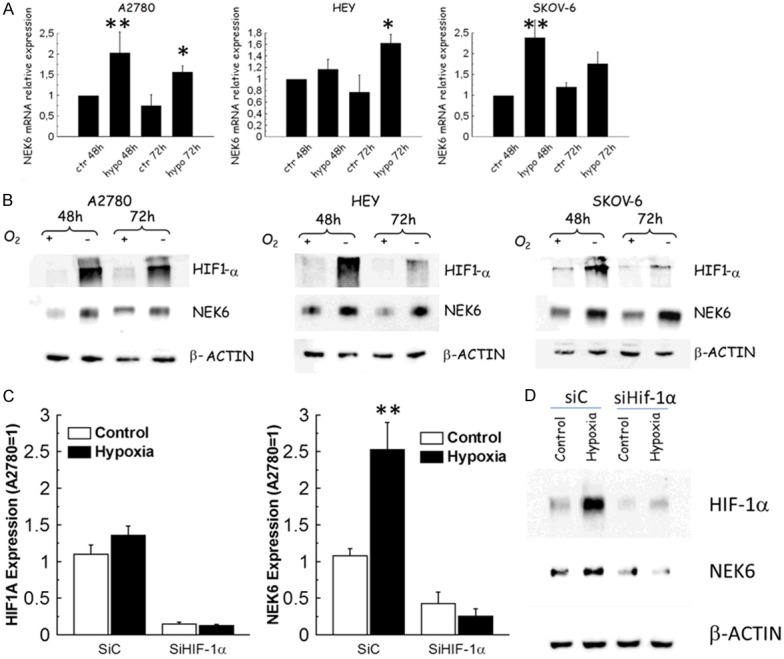
Figure 2.

Expression analysis of NEK6 and HIF1A in a panel of ovarian cancer cells exposed to hypoxia for 48h and 72 h. In all the charts single and double asterisks indicate a P<0.05 or P<0.001, respectively. A. Bar charts indicate that hypoxia increases NEK6 expression in all the cell lines after 48 and 72h of hypoxia. Bar and error bars refer to mean and standard deviation of two independent experiments performed in triplicate samples. B. Representative western blot analysis obtained in whole cell lysates from the same cell lines. Under hypoxic condition Nek6 is induced both 48 h and 72 h in all cell lines examined. b-actin served as a loading control and Hif-1α as a marker of actual exposure to hypoxia. C. Bar chart reporting the effects of Hif-1α silencing in terms of HIF1A and NEK6 expression assessed through qPCR. Bar and error bars refer to mean and standard deviation of two independent experiments performed in triplicate samples. D. Western blot analysis for Hif-1α and Nek6 in A2780 cells transiently transfected with control silencing siC or with siHif-1α. β-actin was used as a loading control. The increase of expression of both Hif-1α and Nek6 upon 48 h of hypoxia is visible in siC transfected cells but not in those transfected with siHIF-1α. This figure demonstrates both the efficiency of Hif-1α silencing and dependence of Nek6 on Hif-1α. This experiment was repeated twice with similar results.
