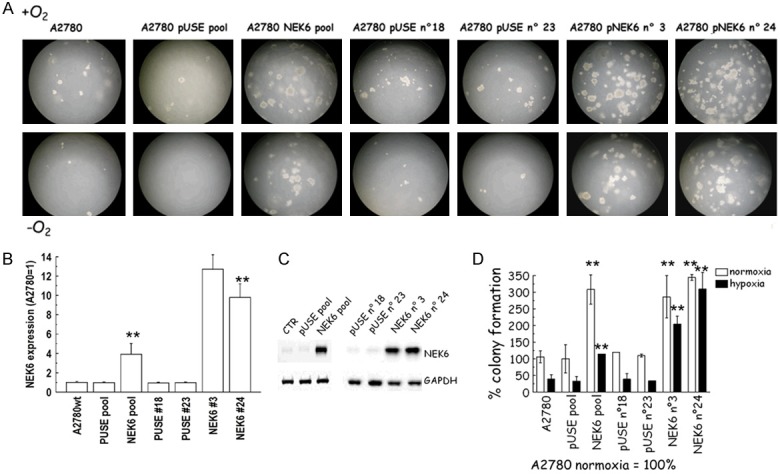
Figure 5.

(A) Representative images of the anchorage independent clonogenic growth of A2780 cells obtained with Nek6 overexpression. (B-D) Nek6 over-expression in A2780 cells. A2780 cells were stably transfected with a construct carrying the NEK6 coding sequence and with the empty vector (pUSE). Two clones were selected from each pool population, qPCR analysis (B) and western blot (C) show Nek6 overexpression in A2780-NEK6, compared to A2780-pUSE control clones. (D) The soft agar assays represented in (A) were quantified by counting the number of colonies formed. The graph shows the results expressed as % of colony formation. Increase of number of colonies was significant in both hypoxia and normoxia in all the clones with Nek6 overexpression (double asterisks, P<0.001, ANOVA).
