
Figure 2.
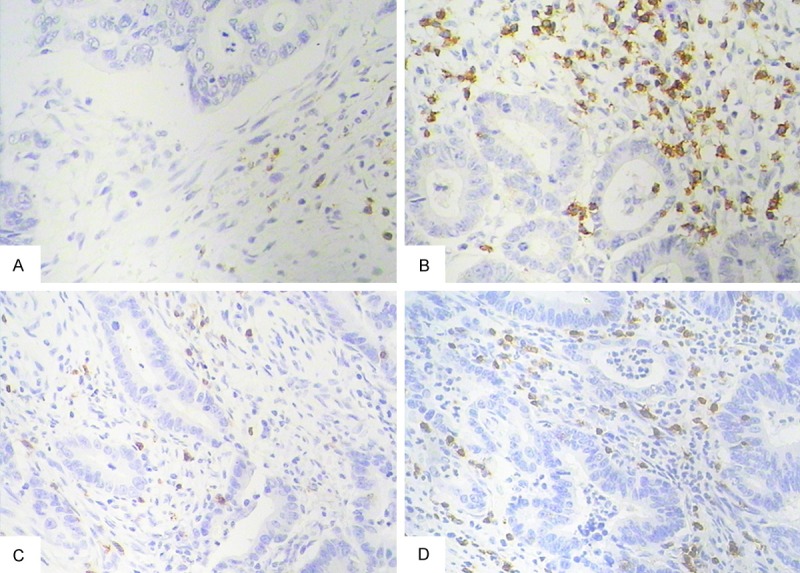
Chemoradiotherapy (CRT)-induced alterations in the microscopic appearance of rectal cancer tissues stained for CD3+ and CD8+ from the same patient. A. CD3+TILs in a pretreatment biopsy specimen; B. Enhanced CD3+TILs in a post-CRT resected specimen; C. CD8+TILs in a pretreatment biopsy specimen; D. Enhanced CD8+TILs in a post-CRT resected specimen (magnification for panels a and b: ×200).