Figure 4.

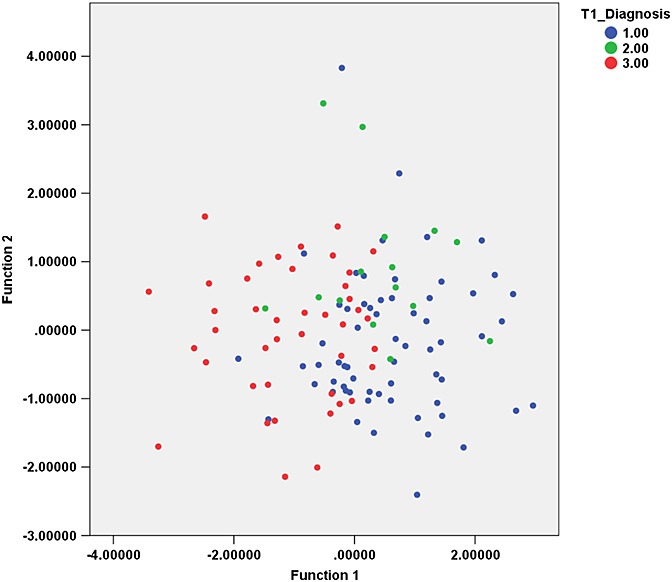
Canonical discriminant functions for texture analysis of T1-weighted images. Groups: 1, medulloblastoma; 2, ependymoma; 3, pilocytic astrocytoma.

Canonical discriminant functions for texture analysis of T1-weighted images. Groups: 1, medulloblastoma; 2, ependymoma; 3, pilocytic astrocytoma.