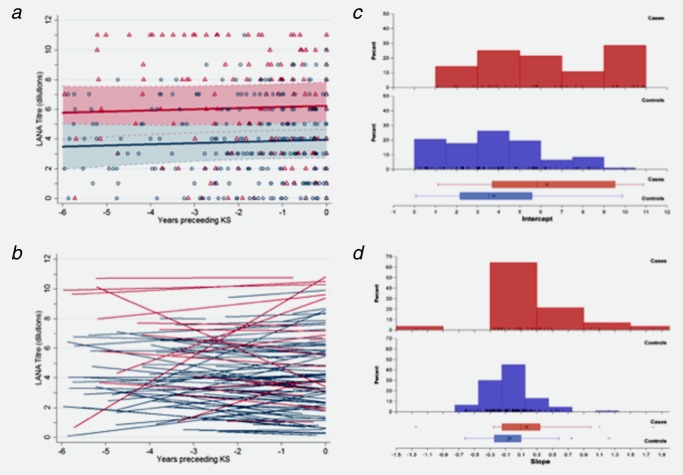
Figure 3.
LANA titres in the six years prior to diagnosis (for cases) or pseudo-diagnosis (for controls). (A) for Kaposi's sarcoma (KS) cases (red symbols and lines) and non-KS controls (blue symbols and lines) with predictions bases on the GEE (A) and random effects (B) regression models presented in Table 2. GEE regression model predictions are based on a group of patients in a 1:1 sex ratio, at the median of 37 years at diagnosis and with a C04 count between 200 and 500 cells/ml; the shaded areas represented the 95% confidence intervals. Random effects model predictions are the fitted lines for each individual patient with at least 2 measurements. Distributions of individual intercept (C) and slope (D) estimates from the random effect model. Red bars/boxes denote KS cases and blue/boxes denote control patients.

