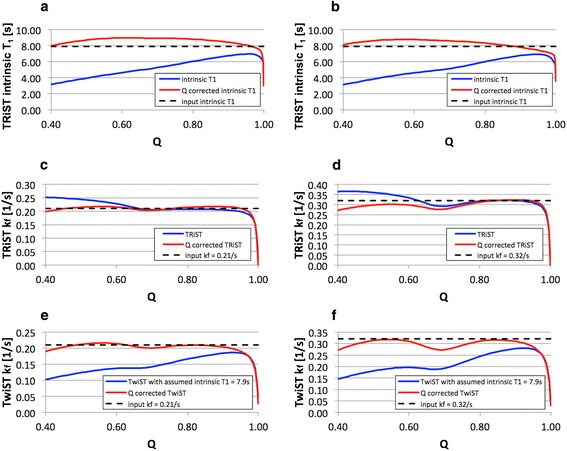
Fig. 4.

Spill-over effects as determined by Bloch equation simulations: T1 intrinsic (solid blue line) as determined with the TRiST method and spill-over corrected T1 Q-intrinsic (solid red line) are shown for a) kf = 0.21 s−1 and for b) kf = 0.32 s−1 as a function of the spill-over ratio Q. Input T1 intrinsic used in the simulation was 7.9 s (dotted black line). c) and d) show the pseudo-first-order rate constant kf as determined with TRiST (solid blue line) and with Q-corrected TRiST (solid red line) for kf = 0.21 s−1 and kf = 0.32 s−1 (dotted black line), respectively. And kf determined with TwiST (solid blue line) and Q-corrected TwiST (solid red line) is shown e) for kf = 0.21 s−1 and f) for kf = 0.32 s−1 (dotted black line). Note that the dip in T1 intrinsic and kf for Q > 0.95 is caused by incomplete γ-ATP saturation, as the range in Q is induced by the variation of the DANTE saturation flip angles
