
Fig. 6.
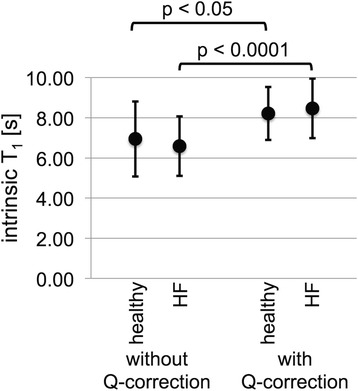
Cardiac PCr T1 intrinsic and Q-corrected T1 Q-intrinsic determined with the TRiST method for healthy (n = 12) and for HF patients (n = 17), shown are mean (dot) and standard deviation (error bars). The intrinsic T1 between the two groups is not significantly different both without and with Q-correction, p = 0.57 and p = 0.63, respectively. Q-correction leads to a significant increase of the intrinsic T1 for both the healthy and HF groups with p < 0.05 and p < 0.0001, respectively