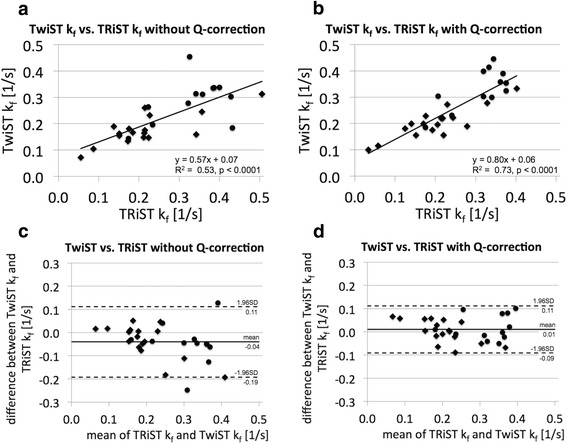
Fig. 7.

a, b Linear correlation and (c, d) Bland-Altman plots for TRiST and TwiST cardiac CK pseudo-first-order rate constant kf determined (a, c) without and (b, c) with spill-over Q-correction. Data from all 29 participants are shown, dots for healthy participants and diamonds for HF patients
