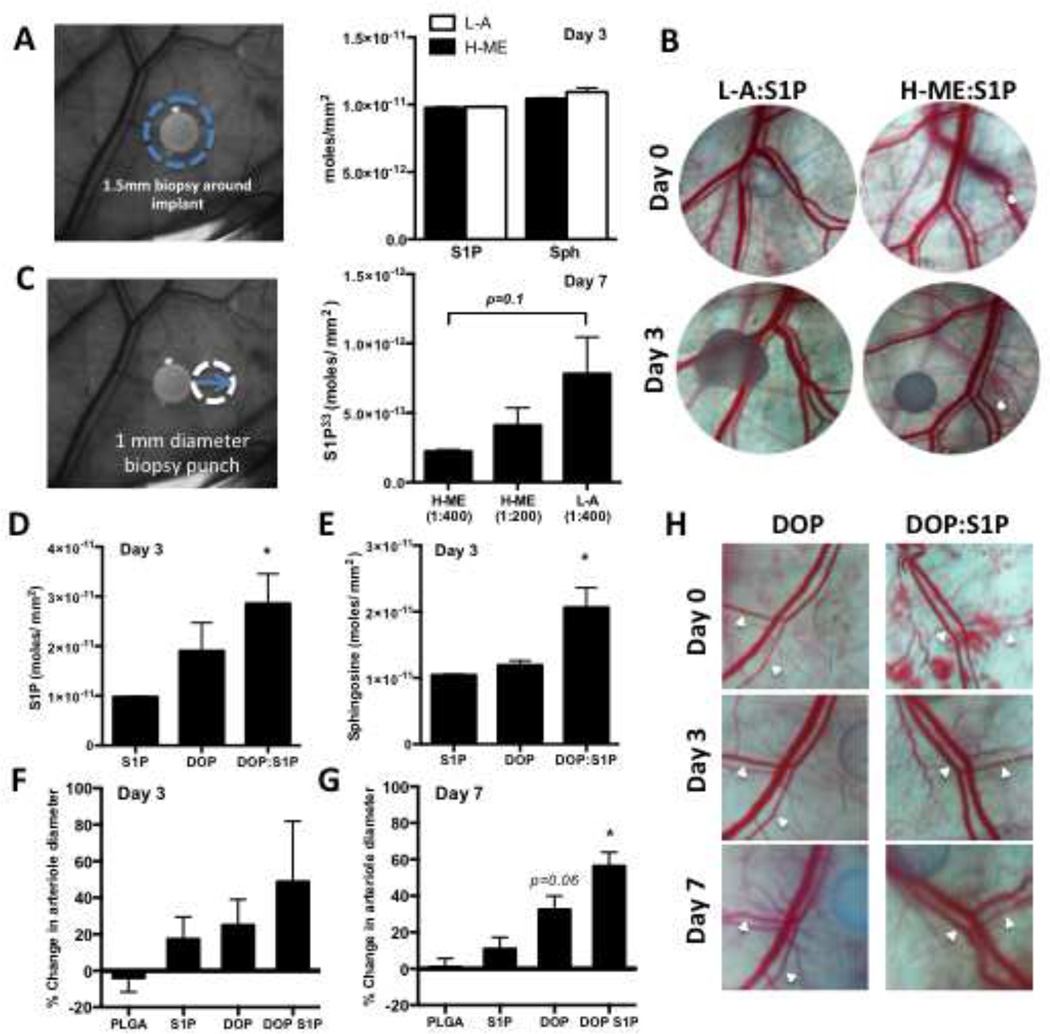
Figure 3. Polymer release properties and local metabolism control peri-implant S1P presentation in vivo.
Total tissue concentration of S1P and sphingosine were measured by HPLC-MS/MS in a 1.5 mm diameter tissue biopsy around the film at 3 days (B, n=3–7 per group) (A). Representative dorsal skin-fold window chamber images from un-loaded and S1P loaded polymer films show no significant difference in vascular remodeling from day 0 to day 3 (B). S1P release was measured in a 1mm tissue biopsy that was harvested directly adjacent to the film after 7 days in the dorsal skin-fold window chamber (C, left) and quantified by P33 concentration (C, n=4–12 per group). S1P (D) and sphingosine (E) were measured after release of the S1P lyase inhibitor DOP or a combination of DOP+S1P for 3 days and percent change in arteriolar diameter was quantified after 3 (F) or 7 days (G) (* p<0.05 compared to PLGA control). Representative images from days 0, 3, and 7 (H). White arrowheads indicate arterioles.

