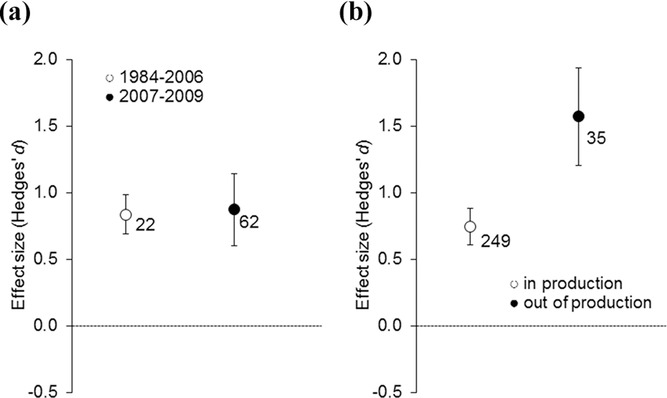
Figure 2.

(a) Changes in effectiveness of agri-environment schemes over time as shown in studies published from 1984 to 2006 compared with studies published from 2007 to 2009 and (b) differences in species diversity between control areas and areas in production (such as fields under organic management) and areas out of production (such as field margins and hedgerows). Shown are mean effect sizes and 95% CI. The mean effect size is significantly different from zero if the CIs do not overlap with zero. Numbers near symbols indicate sample size.
