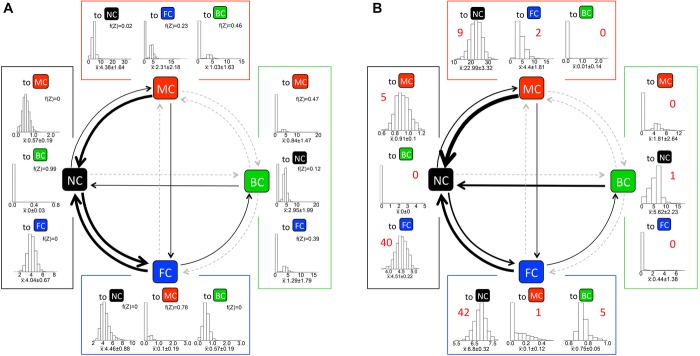
Figure 4.

Transition rates in the Hemimetabola estimated from (A) the RJMCMC model of the single, polytomous tree and from (B) 1000 unrestricted (i.e. FULL.NR) ML models of randomly resolved trees. Arrow width is proportional to transition rate; gray dashed lines indicate rates where SD of the rate distribution overlapped zero. In (A), histograms show the posterior distribution of rates across all five RJMCMC chains (n = 500,900); the median ± SD is given separately along with the frequency the rate was set to Z. In (B), histograms show distributions of the ML values for each rate across 1000 random resolutions of the parent tree with median ± SD given separately; figures above graphs indicate median transition counts per tree, estimated by stochastic character mapping using an unrestricted (i.e. FULL.NR) model.
