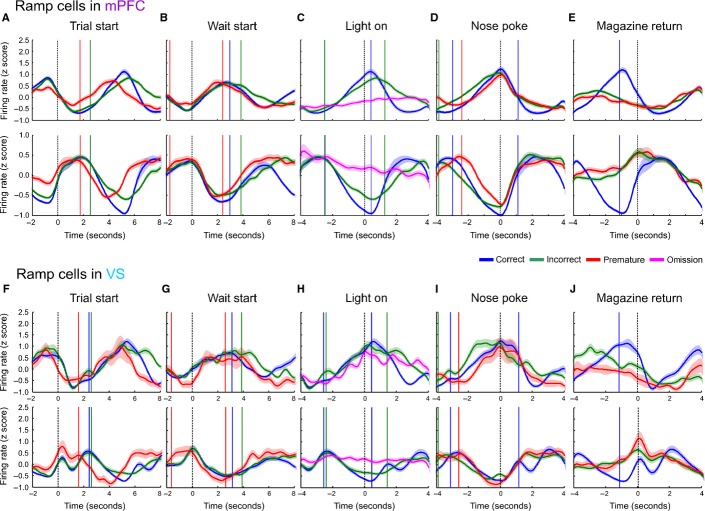
FIG. 4.
Ramping activity in the mPFC and VS. (A) Mean population PSTH of mPFC cells with positive (top) and negative (bottom) ramping activity aligned to the trial start. (B) Population PSTH of mPFC ramping cells aligned to the wait-start event. (C) Ramping cells in the mPFC aligned to the time of stimulus light presentation (omission trials are shown in purple). (D) Ramping cells in the mPFC aligned to nose-poke event. (E) Ramping cells in the mPFC aligned to magazine return event. (F–J) As A–E, for ramping cells recorded in the VS.

