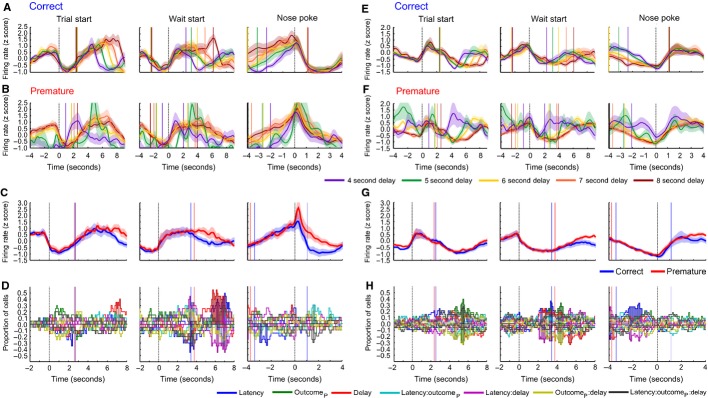
FIG. 7.

Population activity of ramping cells in the mPFC recorded during variable delay sessions. (A) Population activity around three alignment events (from left to right trial start, wait-start and nose-poking) for trials ending in correct responses recorded in positive ramping cells. Responses are divided by the delay of the trial (represented as a rainbow colour scale). The median time of the next, or previous behaviour event is indicated as a vertical line in the same colour as the firing rate for each delay. (B) As A, for premature responses in positive ramping cells. (C) PSTH of population average ramping activity for positive ramping cells (averaged over all delays), aligned to trial start (left), wait-start (middle), and nose-poking (right). (D) Proportions of cells with significant effects of each independent variable (see colour key for the colour of each variable, where outcomeP represents premature outcome) and firing rate. (E–H) As A–D, for negative ramping cells.
