
Figure 2. SOCS1KI mice did not exhibit reduced Treg cell numbers.
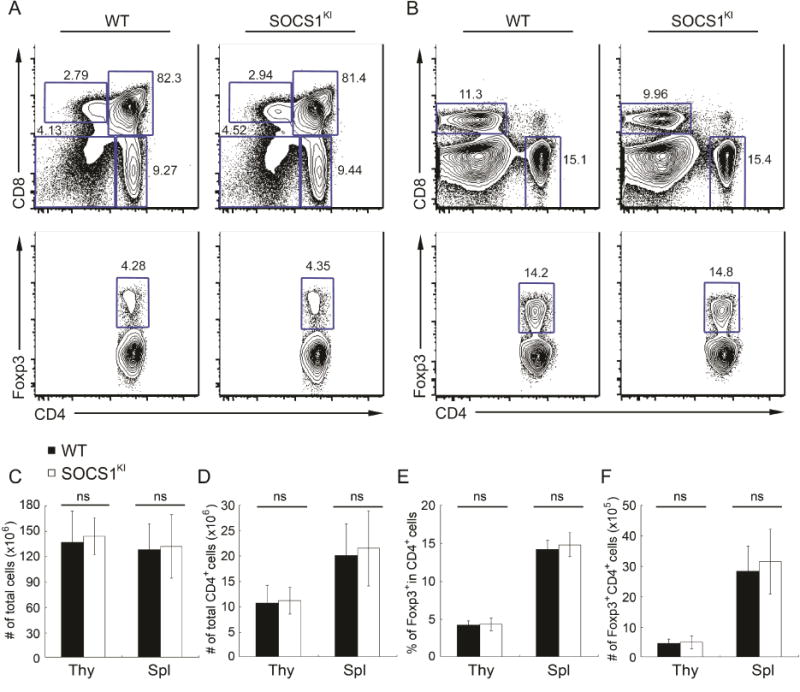
FACS analysis of (A) thymus and (B) spleen in 6~8 week old SOCS1KI mice and wild-type littermates. Percentages of different thymocyte and splenocyte subsets are shown. (C–F) Cellularity of the thymus and spleen and the proportion and absolute numbers of thymis and splenic Foxp3+CD4+ T cells in SOCS1KI and WT mice are shown. The data are shown as mean ± SD and are representative of four independent experiments (n = 4–8). See also Figure S3.