
Extended Data Figure 11. Sample ontology enrichment analysis (SOEA).
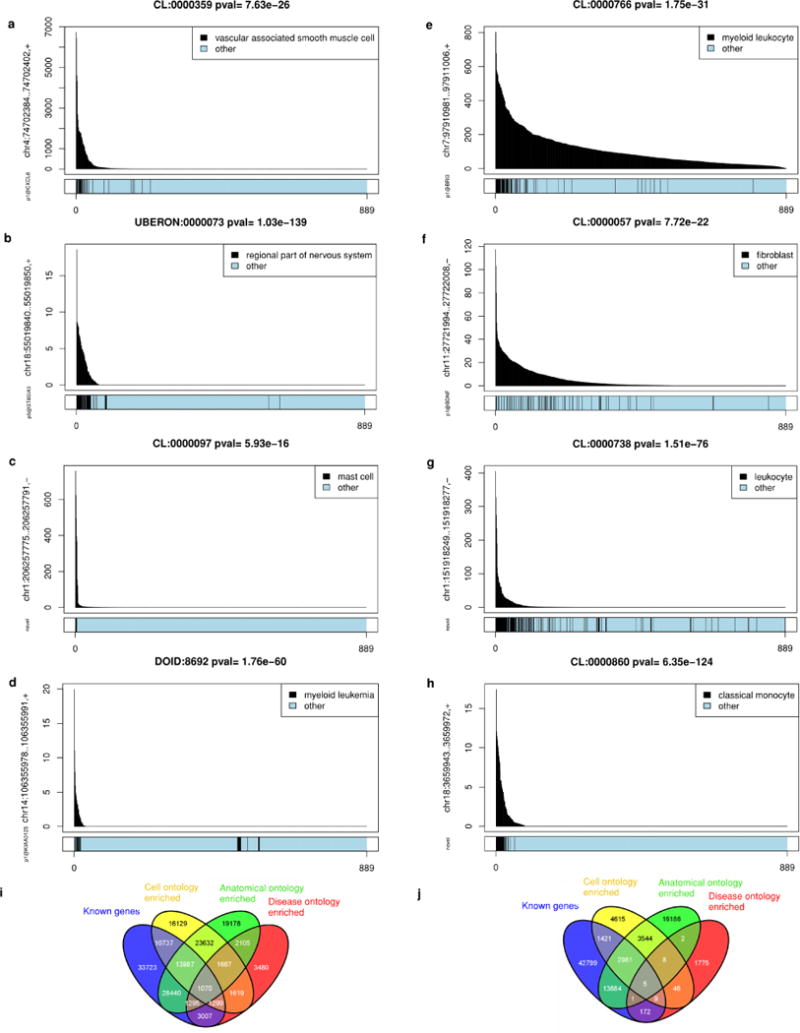
Expression profile-sample ontology associations were tested by Mann–Whitney rank sum test to identify cell, disease or anatomical ontology terms over-represented in ranked lists of samples expressing each peak. a, p1@CXCL6 enriched in vascular associated smooth muscle cells. b, p5@ST8SIA3 enriched in brain tissues. c, Novel peak enriched in mast cells. d, p1@KIAA0125 enriched in myeloid leukaemia. e, p1@BRI3 enriched in myeloid leukaemia. f, p1@BDNF enriched in fibroblasts. g, Novel peak enriched in leukocytes. h, Novel peak enriched in classical monocytes. i, j, Venn diagrams showing degree of overlap between peaks associated to known genes (blue), cell ontology enriched (yellow), Uberon anatomical ontology enriched (green) and disease ontology (red). i, At a threshold of 10−20 (Mann–Whitney rank sum test), 64% (59, 835 out of 93, 558) of the expression profiles of human known transcripts and 74% (67, 810 out of 91, 269) of the expression profiles for novel transcripts show enrichment for one or more sample ontologies. j, Mouse sample ontology enrichment 10−20 threshold. 30% (18, 273 out of 61, 134) known are enriched and 47% (26, 176 out of 55, 143) novel are enriched.