
Extended Data Figure 2. Broad and sharp promoters.
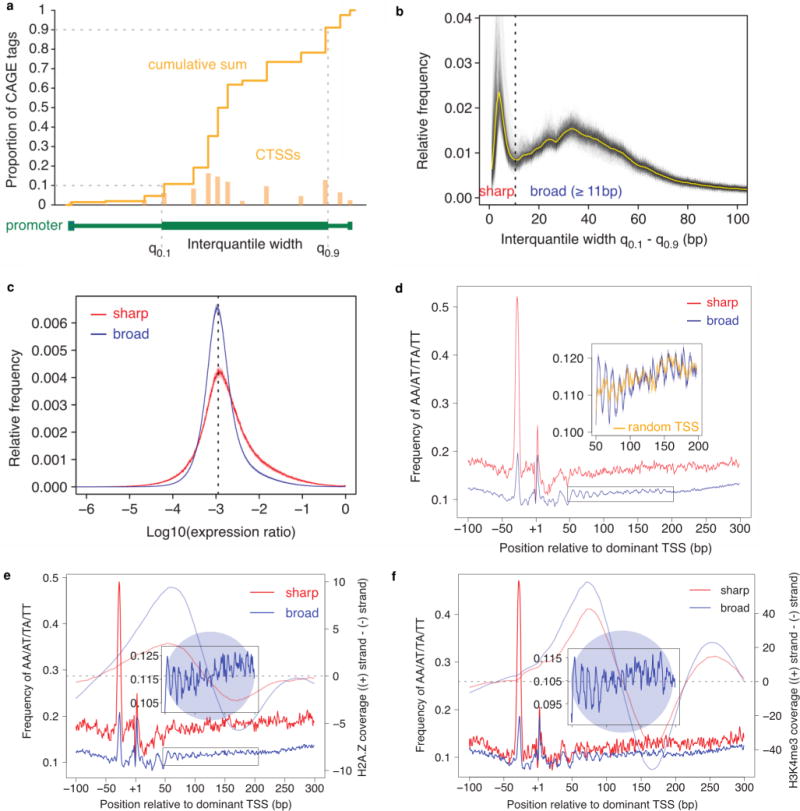
DPI peaks from the permissive set were aggregated by grouping neighbouring peaks less than 100 bp apart. Cumulative distribution of CAGE signal along each region was calculated and positions of 10th and 90th percentiles were determined. a, Schematic representation of CAGE signal within promoter region and calculation of interquantile width. Signal from CAGE transcription start sites (CTSS) is shown. Distance between these two positions (interquantile width) was used as a measure of promoter width. b, Distribution of promoter interquantile width across all 988 human samples. Individual grey lines show distribution in each sample and the average distribution is shown in yellow. For each sample only promoters with > = 5 TPM were selected. Distribution of obtained interquantile width was clearly bimodal and allowed us to set the empirical threshold at 10.5 bp that separates the best sharp from broad promoters. c, Distribution of expression specificity. The distribution of log ratios of expression in individual samples against the median expression across all samples is shown separately for sharp and broad promoters. Solid line shows the average distribution for all samples and the semi-transparent band denotes the 99% confidence interval. The dashed line corresponds to an expected log ratio if all samples contributed equally to the total expression. d, Average frequency of AA/AT/TA/TT (WW) dinucleotides around dominant TSS of sharp (red) and broad (blue) promoters across all human samples. Lines show the average signal and semi-transparent bands indicate the 99% confidence interval. Closer view of WW dinucleotide frequency displaying 10 bp periodicity is shown in the inset and indicates the likely position of the +1 nucleosome. For comparison, the signal aligned to randomly chosen TSS in broad promoters is shown in orange. e, As in a but for promoters in CD14+ monocytes. H2A.Z signal (subtracted coverage − plus strand coverage − minus strand coverage) around sharp and broad promoters is shown in corresponding semi-transparent colours (data from ref. 51). Transition point in subtracted coverage from positive to negative values indicates the most likely position of the nucleosome (shown as semitransparent blue circle) centre. f, As in b but for promoters in frontal lobe. H3K4me3 signal (subtracted coverage = plus strand coverage – minus strand coverage) around sharp and broad promoters is shown in corresponding semi-transparent colours (data from ref. 52).