
Extended Data Figure 3. Density plots of DPI peaks maximum and median expression.
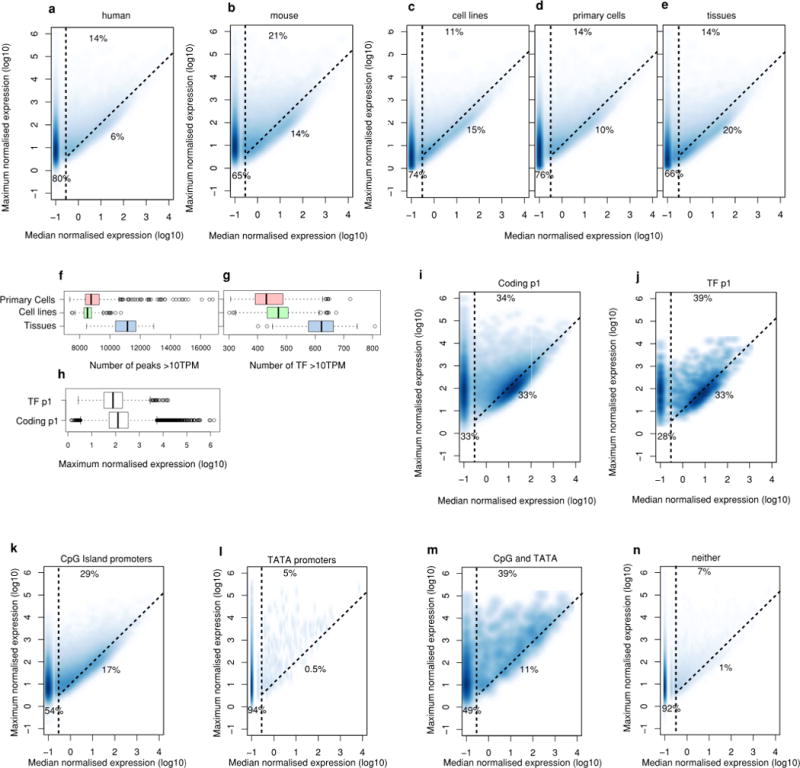
a, Distribution for all human robust peaks. b, Distribution for all mouse robust peaks. Fraction on left of vertical dashed line corresponds to peaks with non-ubiquitous (cell-type-restricted) expression patterns (median < 0.2 TPM). Fraction below the diagonal dashed line corresponds to ubiquitous-uniform (housekeeping) expression profiles (less than tenfold difference between maximum and median). Fraction in top-middle corresponds to ubiquitous-non-uniform expression profiles (maximum > tenfold median). c–e Show distibutions based on cell line, primary cell and tissue data, respectively. The mixture of cells in tissues may overestimate the fraction of ubiquitously expressed genes. f, Boxplot showing the number of peaks and detected > = 10 TPM in primary cells, cell lines or tissues. g, As in a but showing transcription factor p1 peaks only. h, Boxplot showing maximum expression of the main promoter for transcription factors or all coding genes. i, Density plots of human robust DPI peaks maximum and median expression for the main promoter of coding genes. j, As in d but showing the main promoter of transcription factors. Fraction on the left of the vertical dashed line corresponds to peaks with non-ubiquitous (cell-type-restricted) expression patterns (median < 0.2 TPM). Fraction below the diagonal dashed line corresponds to ubiquitous-uniform (housekeeping) expression profiles (less than tenfold difference between max and median). Fraction above the diagonal and to the right of the vertical dashed lines corresponds to ubiquitous-non-uniform expression profiles (maximum > tenfold median). k, Distribution for peaks with CpG island only (n = 55,897). l, Distribution for peaks with only a TATA motif (n = 3,933). m, Distribution for peaks with both CpG islands and TATA box motifs (n = 834). n, Distribution for DPI peaks with neither a TATA motif nor CpG island (n = 124,152). Fraction on the left of the vertical dashed line corresponds to peaks with non-ubiquitous (cell-type-restricted) expression patterns (median < 0.2 TPM). Fraction below the diagonal dashed line corresponds to ubiquitous-uniform (housekeeping) expression profiles (less than tenfold difference between max and median). Fraction above diagonal and to right of vertical dashed lines corresponds to ubiquitous-non-uniform expression profiles (maximum > tenfold median).