
Extended Data Figure 4. Cross-species projected super-clusters.
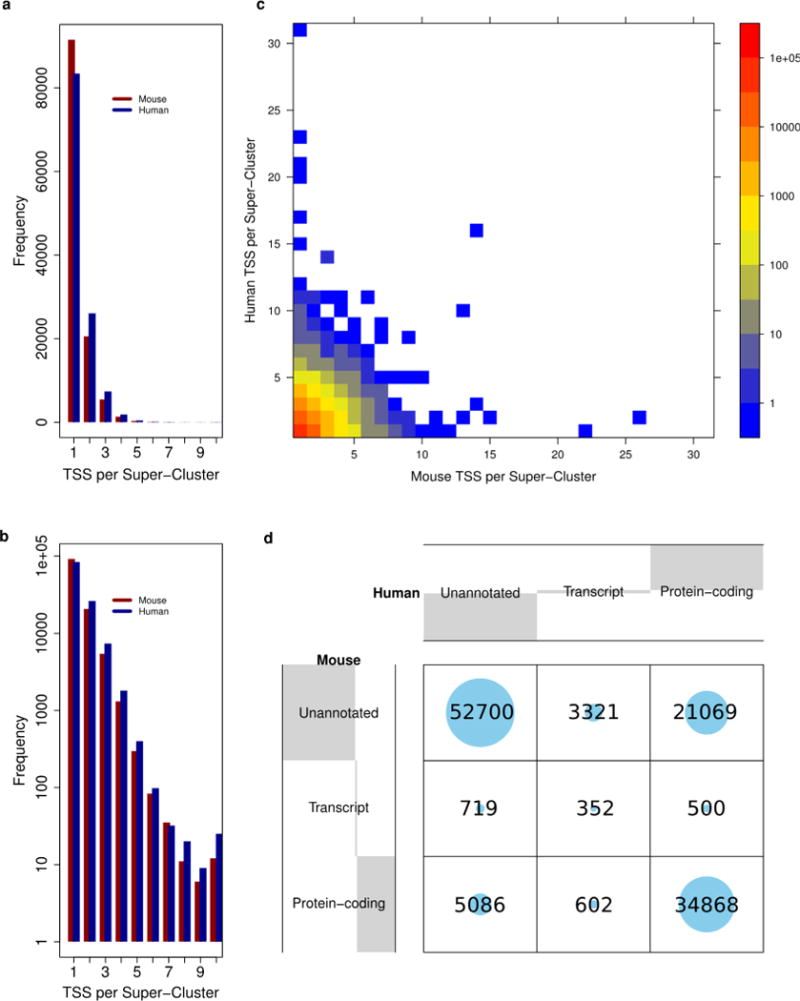
a, The number of mouse and human TSSs (both permissive and robust) per projected super-cluster. b, Same data as presented in panel a, with the y axis on a log scale. There is a slight tendency for more human TSSs per super-cluster than mouse TSSs. c, The number of human and mouse TSSs per projected super-cluster, density of data points indicated by log-scaled colour gradient shown on the right. Most super-clusters contain < = 4 DPI defined TSSs in both species. d, Evaluating the conservation of TSS annotation between species. Projected super-clusters are annotated by the most functional contributing TSS from each species (see Methods). Grey shading in the margins summarizes the proportion of super-clusters with each category of annotation in both mouse (y axis) and human (x axis). Numbers and volumes of circles represent counts of projected super-clusters, for example there are 34,868 super-clusters in which > = 1 human and > = 1 mouse component TSS are annotated as protein coding and 719 super-clusters in which the human TSSs are unannotated and at least one of the mouse TSSs are annotated as the 5′ end of a non-coding transcript.