
Extended Data Figure 6. Features of cell-type-specific promoters.
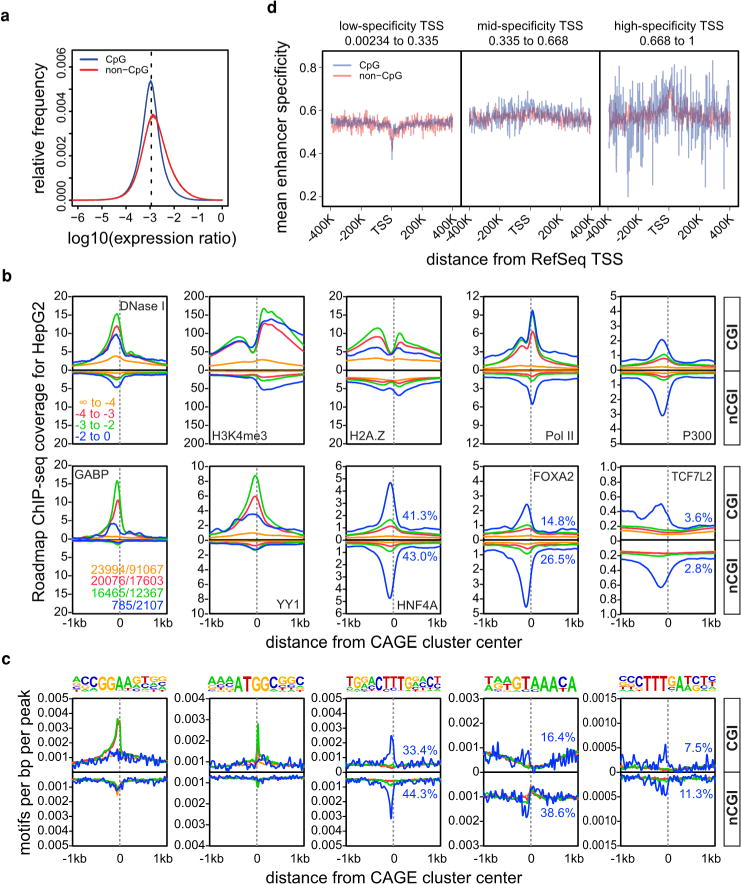
a, The distribution of expression log ratios of all individual samples against the median of all samples is shown separately for CGI-associated and non-CGI-associated CAGE clusters. The dashed line corresponds to an expected log ratio if all samples contribute equally to the total expression. b, Histograms for genomic distance distributions of HepG2 DNase I hypersensitivity, H3K4me3, H2A.Z, POL2, P300, GABP, YY1, HNF4A, FOXA1 and FOXA2 ChIP-seq tag counts centred across CGI-associated and non-CGI-associated CAGE clusters (separated according to expression specificities) across a 2 kilobase (kb) genomic region. Expression specificity bins are colour-coded (as indicated in the DNase I panel) with blue representing the highest degree of specificity. Numbers of regions in bins are given in the GABP panel (CGI no. / nCGI no., colour coding as above). c, Histograms for genomic distance distributions of ChIP-seq-derived sequence motifs for GABP, YY1, HNF4A, FOXA1 and FOXA2 (corresponding to the samples in the lower panel of c) centred across CGI-associated and non-CGI-associated CAGE clusters (separated according to expression specificities) across a 2 kb genomic region. Motifs are shown on top. The percentage of promoters overlapping with ChIP-seq peaks (b) or consensus sequences (c) for transcription factors binding the highest specificity clusters (HNF4A, FOXA2, TCF7L2) is also given in blue. d, Plots showing mean expression specificity (high values indicate more constrained expression over cells, see the accompanying manuscript4) in enhancers close to RefSeq promoters as a function of promoter CpG content and three classes of promoter expression specificity.