
Extended Data Figure 7. Extended features of cell-type-specific promoters.
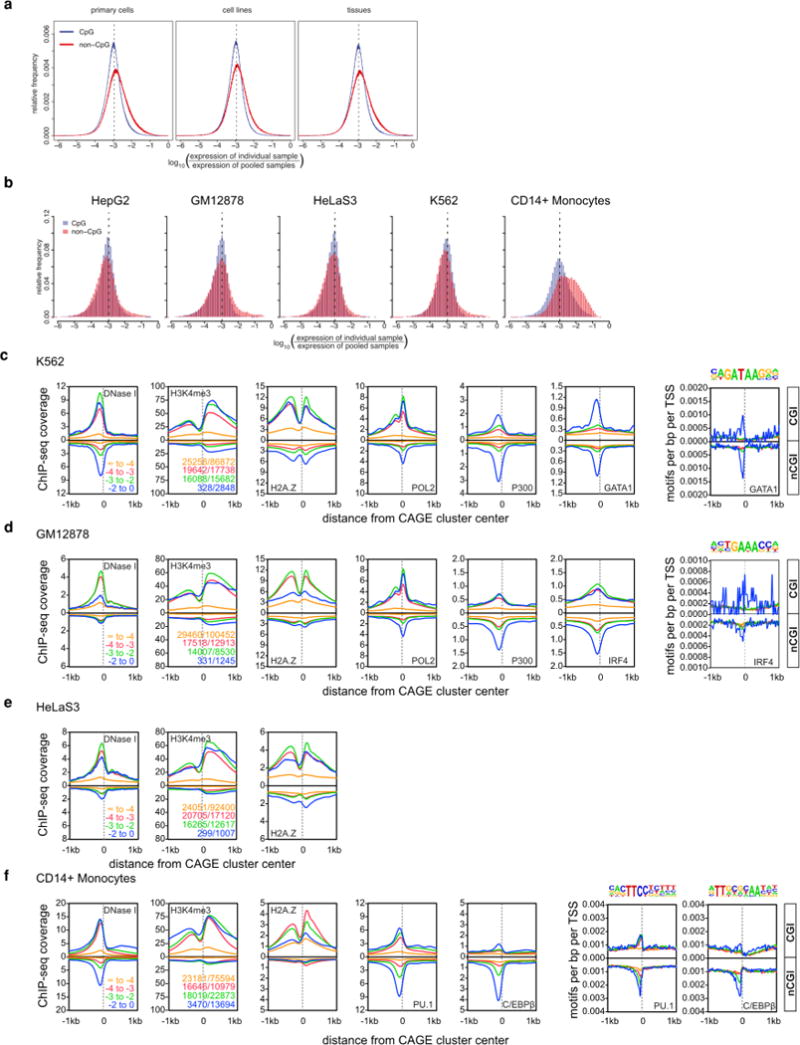
a, Distribution of global expression specificity estimated using primary cells, cell lines or tissues only. b, Distribution of expression specificity for HepG2, GM12878, HeLaS3, K562 and CD14+ monocytes (distribution of expression log ratios of all individual samples against the median of all samples is shown separately for CGI-associated and nonCGI-associated CAGE clusters. The dashed line corresponds to an expected log ratio if all samples contribute equally to the total expression). c, Histograms for genomic distance distributions of K562 DNase I hypersensitivity, H3K4me3, H2A.Z, POL2, P300, GATA1 ChIP-seq tag counts centred across CGI-associated and non-CGI-associated CAGE clusters (separated according to expression specificities) across a 2 kb genomic region. Expression specificity bins are colour-coded with blue representing the highest degree of specificity. d, DNase I hypersensitivity, H3K4me3, H2A.Z, POL2, P300 and IRF4 in GM12878. e, DNase I hypersensitivity, H3K4me3, H2A.Z in HeLaS3. f, DNase I hypersensitivity, H3K4me3, H2A.Z, PU.1 and CEBPB in CD14+ monocytes.