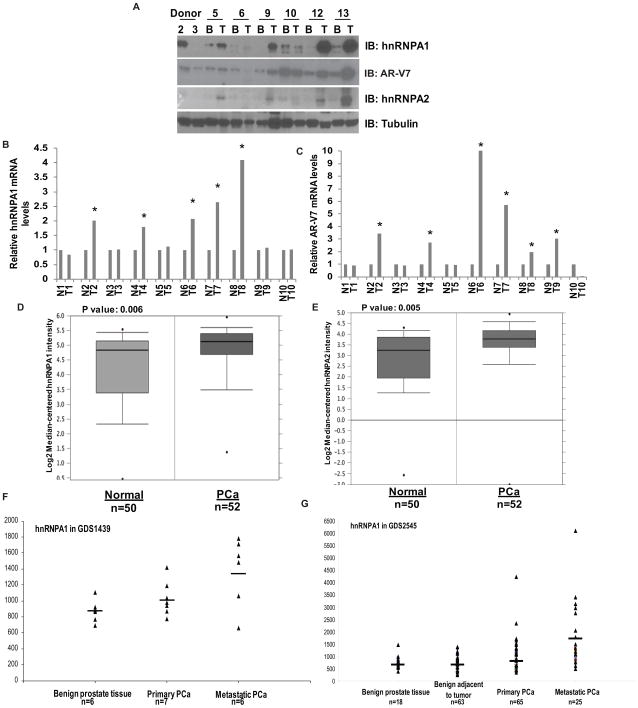
Figure 3.
Expression levels of hnRNPA1 and AR-V7 are positively correlated with each other. A) Representative immunoblot for hnRNPA1, hnRNPA2 and AR-V7 in lysates from 27 paired benign and tumor patient samples. qRT-PCR of mRNA levels of (B) hnRNPA1 and (C) AR-V7 in 10 paired normal and tumor clinical prostate samples. Results are presented as means ± SD of 2 experiments performed in triplicate. * denotes p≤0.05. Relative expression levels of hnRNPA1 (D) and hnRNPA2 (E) in the representative Singh_prostate (n=102) dataset from Oncomine. Relative expression levels of hnRNPA1 in GDS1439 dataset (F) and in GDS2545 dataset (G) from GEO.

